Figure 7.

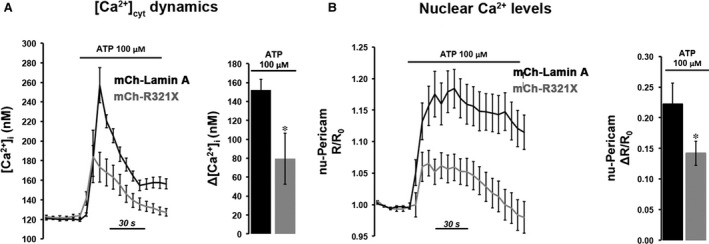
Real time evaluation of ATP‐induced cytosolic and nuclear Ca2+ changes. (A) Fura‐2 loaded HEK293 cells expressing either mCh‐Lamin A or mCh‐R321X were challenged with the Ca2+‐mediated agonist ATP. Histogram showing the ATP‐induced Δ[Ca2+]cyt in mCh‐Lamin A (black bar) and mCh‐R321X (grey bar) HEK293 cells. Data are expressed as mean ± S.E.. Statistical analysis was performed on three independent experiments and significance calculated by Student's t‐test for unpaired samples. *P < 0.05 versus mCh‐Lamin A. (B) nu‐Pericam‐HEK293 cells expressing either mCh‐Lamin A or mCh‐R321X were challenged with the Ca2+‐mediated agonist ATP. Histogram shows the ATP‐induced ΔR/R0 in mCh‐Lamin A (black bar) and mCh‐R321X (grey bar) HEK293 cells. Data are expressed as mean ± S.E.. Statistical analysis was performed on three independent experiments and significance calculated by Student's t‐test for unpaired samples. *P < 0.05 versus mCh‐Lamin A.
