Figure 3.

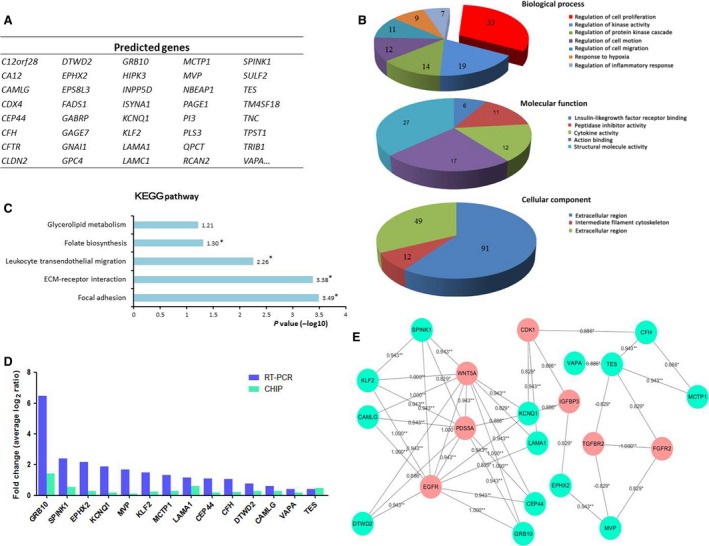
Changes of gene expression profile in HOTAIRM1 Knockdown HT29 cell. (A) Partial differently expressed genes in HOTAIRM1 Knockdown HT29 cell. (B and C) Gene ontology (GO) and KEGG pathway analysed the biological process, molecular function, cellular component and signalling pathways of 602 DEGs via DAVID 6.7 (*P < 0.05). (D) The 14 DEGs from microarray were verified by real‐time PCR. (E) The coexpression net‐work of 14 DEGs was presented by Cytoscape, and was analysed by Spearman coefficient with referential proliferation‐related genes (shown in red).
