Figure 2.

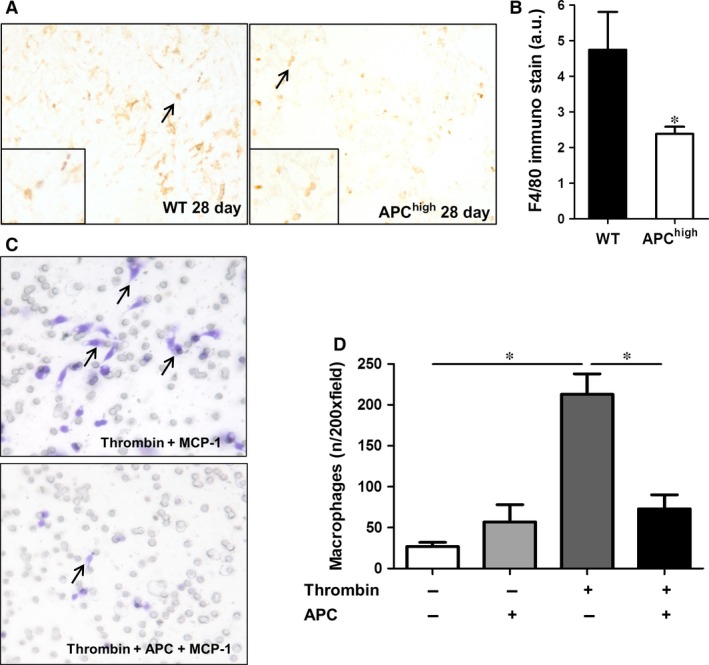
Effect of high endogenous APC levels on macrophage recruitment. (A) Representative pictures of F4/80 stained lung sections obtained 28 days after bleomycin instillation in wild‐type (WT) and APC high mice (100× magnification). The arrows point to (examples of) F4/80 positive macrophages. (B) Quantification of macrophage numbers in mice 28 days after bleomycin instillation. (mean ± SEM, n = 8 per group, *P < 0.05). (C) Representative pictures of RAW264.7 cell migration towards MCP‐1 after stimulation with thrombin (10 nM) in the presence or absence of rhAPC (10 nM). The arrows indicate examples of stained macrophages. (D) Quantification of the data presented in C (mean ± SEM of an experiment performed three times, *P < 0.05). APC, activated protein C.
