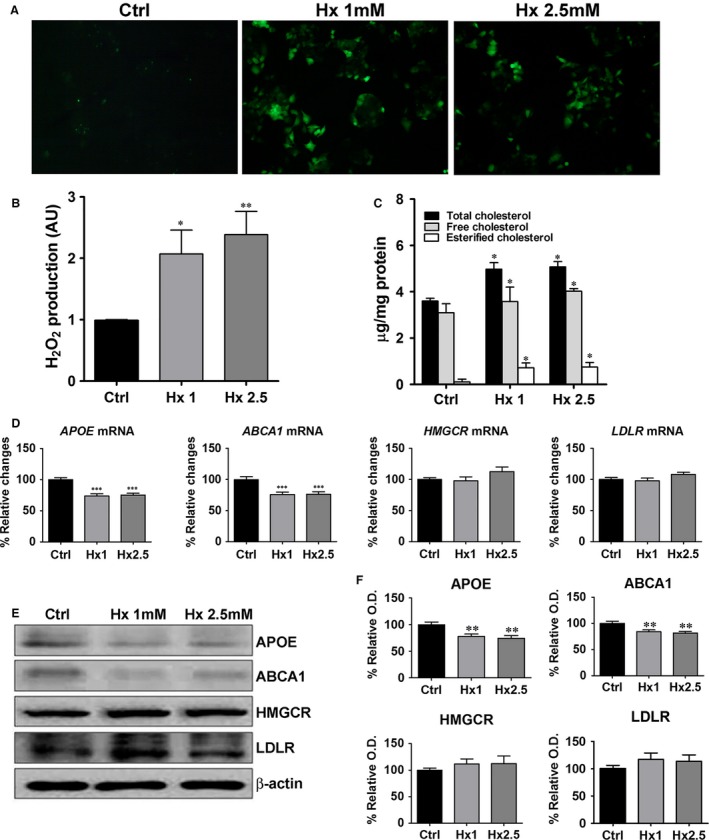
Figure 2.

Hypoxanthine induces ROS generation and cholesterol accumulation in HepG2 cells by down‐regulation of reverse cholesterol transport gene. (A) HepG2 cells were treated with different concentrations of hypoxanthine (1, 2.5 mM) for 2 hrs and ROS levels were evaluated by the oxidation of H2DCF‐DA to DCF. Intracellular ROS levels were determined using a fluorescence microscope (magnification, 400×). (B) The levels of H2O2 were determined by the Amplex red assay. (C) HepG2 cells were treated with different concentrations of hypoxanthine (1, 2.5 mM) for 24 hrs and total cholesterol and cholesteryl ester levels were assayed in cell lysate. (D) HepG2 cells were treated with different concentrations of hypoxanthine (1, 2.5 mM) for 24 hrs. APOE,ABCA1,HMGCR and LDLR mRNA levels were determined by real‐time RT‐PCR. (E) Representative western blot for APOE, ABCA1, HMGCR, LDLR and β‐actin is shown. (F) Relative protein expression was determined using densitometry. Data are presented as mean ± S.E.M. *P < 0.05, **P < 0.01, ***P < 0.001 versus control (Ctrl). AU: arbitrary units.
