
Figure 3.
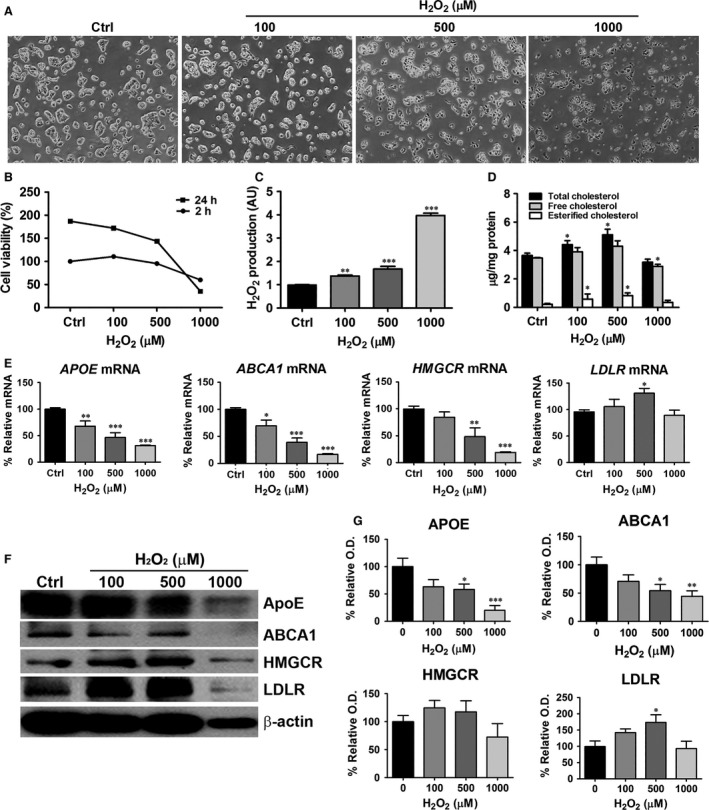
Effects of H2O2 on cholesterol accumulation and lipogenesis‐related genes in HepG2 cells. HepG2 cells were treated with H2O2 (100, 500 and 1000 μM) for 2 hrs (for Amplex red assay) or 24 hrs (for cholesterol quantification, real‐time RT‐PCR and western blot analysis). (A) Light micrographs (magnification 40×) show that H2O2 reduced cell viability. (B) Cell viability was determined using the MTT assay. (C) The levels of H2O2 were determined by the Amplex red assay. (D) Cellular total cholesterol and cholesteryl ester levels were determined from cell lysates. (E) APOE,ABCA1,HMGCR and LDLR mRNA levels were determined by real‐time RT‐PCR. (F) Representative western blot for APOE, ABCA1, HMGCR, LDLR and β‐actin is shown. (G) Relative protein expression was determined using densitometry. Data are presented as mean ± S.E.M. *P < 0.05, **P < 0.01 versus control, ***P < 0.001 versus control (Ctrl). AU: arbitrary units.