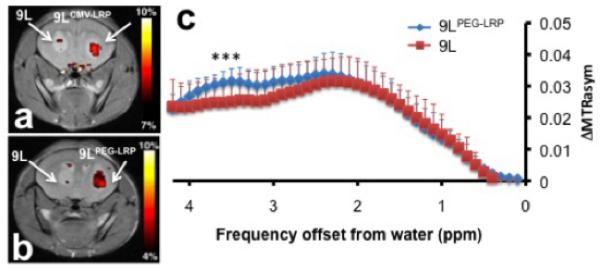
Figure 5.

a, b) Representative CEST maps superimposed on T2-weighted images:Left hemisphere has 9L tumors and right hemisphere has (a) 9LCMV-LRP and (b) 9LPEG-LRP. c) Temporal changes in the ΔMTRasym values (mean ± s.d.; 8 mice) of each tumor type. t-test showed statistical difference of CEST contrast at 3.4-3.6 ppm, (*p<0.05; n=8). Reproduced from (79) with permission.
