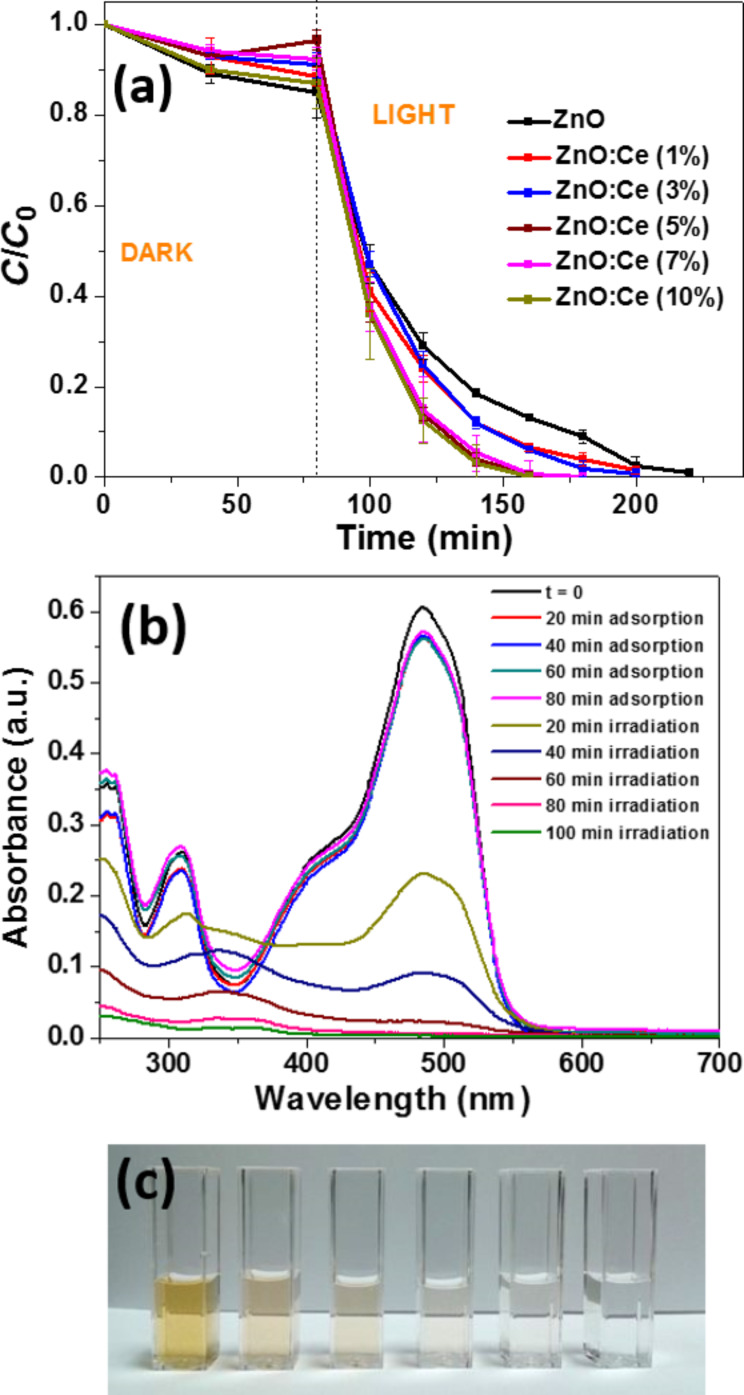
Figure 8.
(a) Influence of the doping in Ce of ZnO rods for the degradation of Orange II in aqueous solution (C is the Orange II concentration at time t, and C0 is the concentration of the dye at t = 0; Volume of solution, 30 mL; Mass of photocatalyst, 30 mg; Orange II concentration, 10 mg/L). (b) Variation of Orange II concentration as a function of irradiation time. (c) Photographs of the Orange II solution during photocatalysis.

