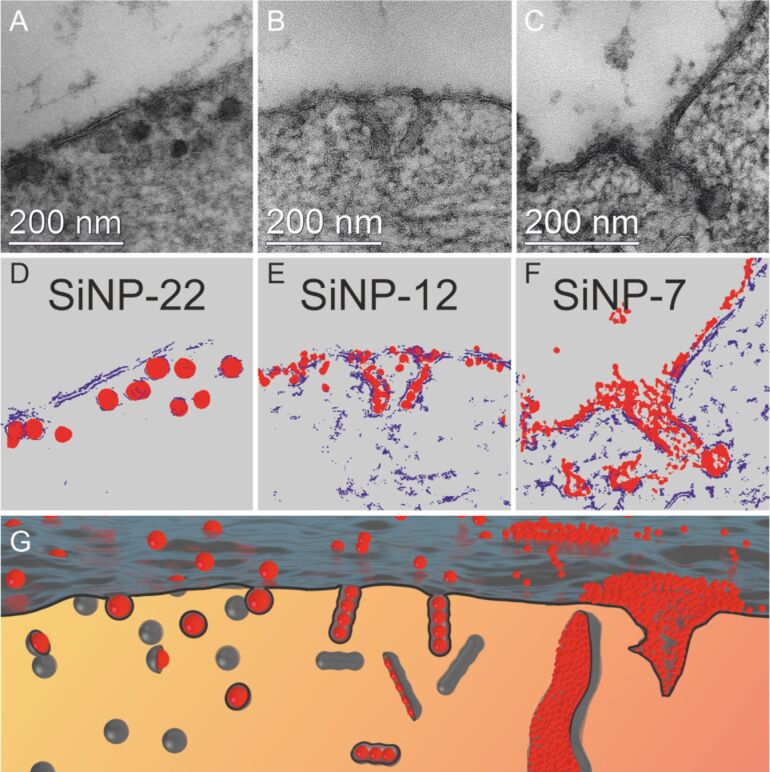
Figure 4.
TEM brightfiled micrographs of high-pressure frozen HeLa cells exposed to SiNPs at a concentration of c = 75 µg·mL−1 for 10 min, stained with OsO4 and uranyl acetate (micrographs A–C show SiNP-22, SiNP-12 and SiNP-7, respectively). For clarification purpose the illustrations in D,E represent the membrane (blue) and the SiNPs (red) as extracted from energy filtered TEM measurements of the above micrographs. Schematic representation of the membrane–particle interaction morphology (G) observed for the different particle sizes.

