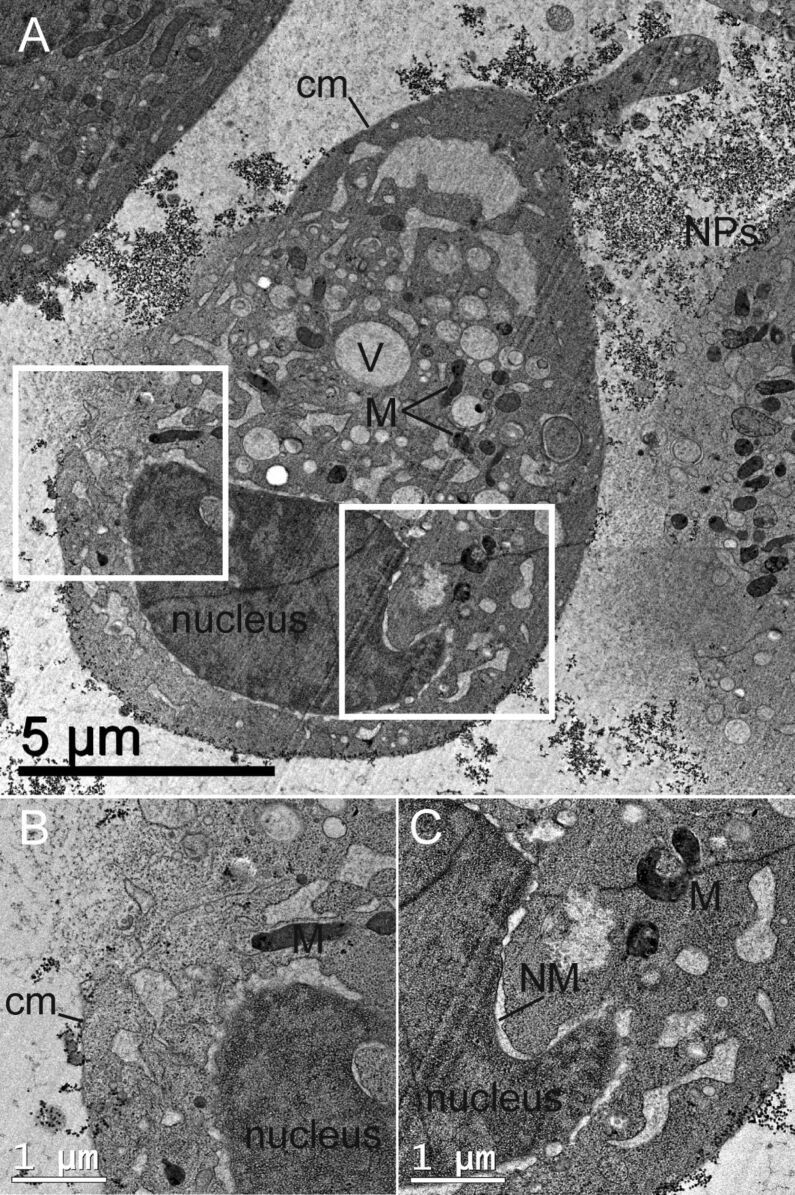
Figure 8.
TEM micrographs of high-pressure frozen HeLa cells treated with 3400 µg·mL−1 of Si-NP22 for 2 h. B and C are close-ups of the central cell in A, showing the cell membrane (cm) leakage and the nuclear membrane (NM) disintegration in more detail. Additionally labeled in the micrograph are the mitochondria (M) and the vacuoles (V).

