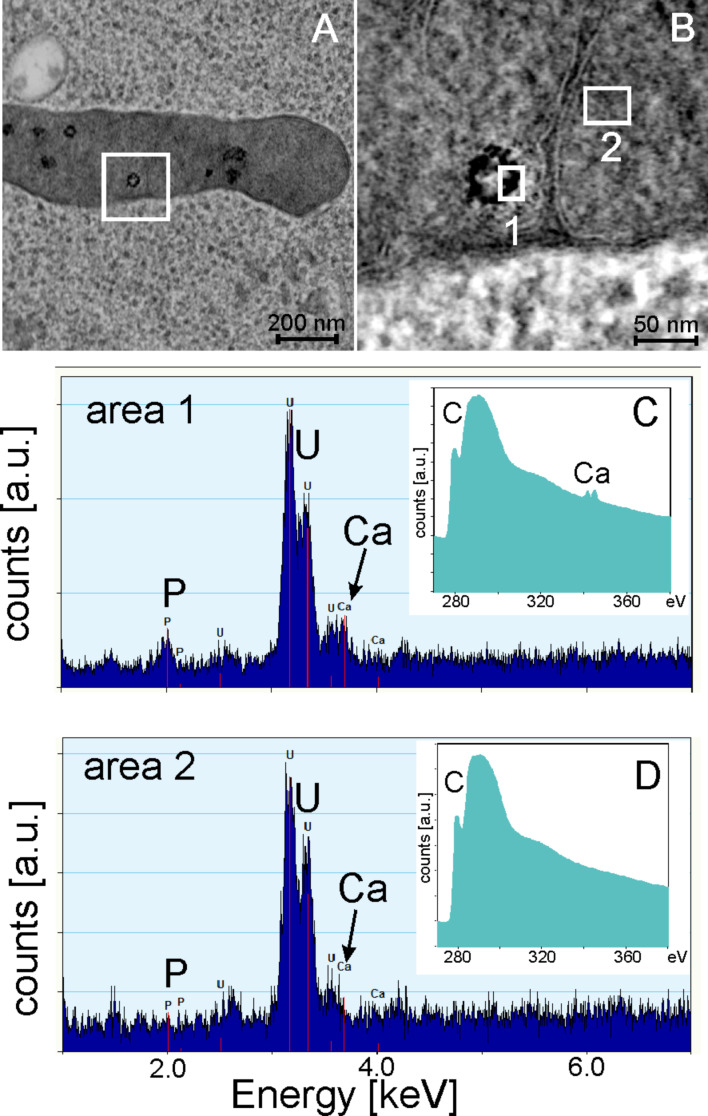
Figure 9.
STEM high angular annular dark field (HAADF) micrograph of a mitochondrion containing darkly stained agglomerates (A) and magnification of the indicated area (B). Image contrast has been inverted to adapt the micrograph to the appearance of conventional TEM bright field images. Local EDX and EELS analysis (C and D) of the areas indicated in B.

