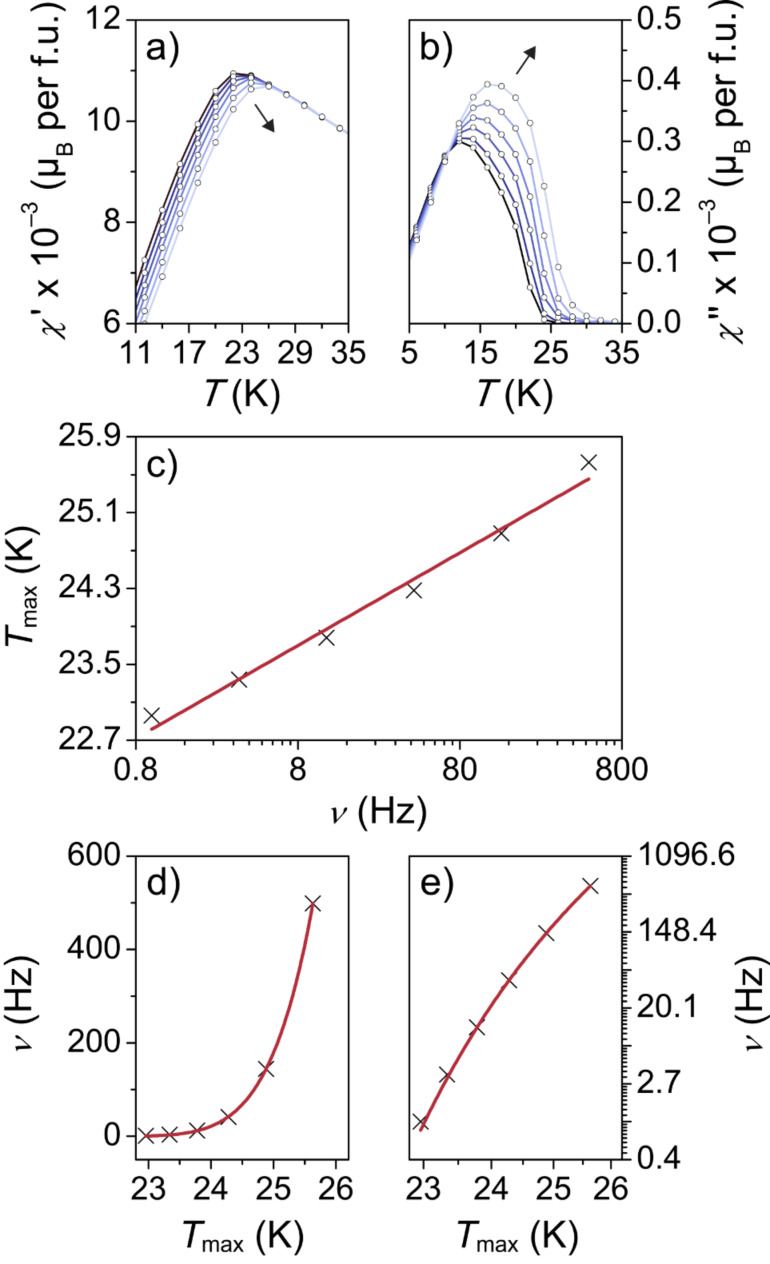
Figure 6.
Alternating-current SQUID magnetometry of as-prepared ZFO nanoparticles with µ0HAC = 0.35 mT. (a) In-phase and (b) out-of-phase parts of the magnetic susceptibility. (c–e) Frequency dependence of the peak temperature in the χ’(T) curve. The red lines are fits to the data according to p = ΔTmax/[Tmax × Δlog(ν)] in (c), ν = ν0 × [(Tmax – T0)/T0]zυ in (d) and ν = ν0 × exp[–Ea/kB(Tmax – T0)] in (e).

