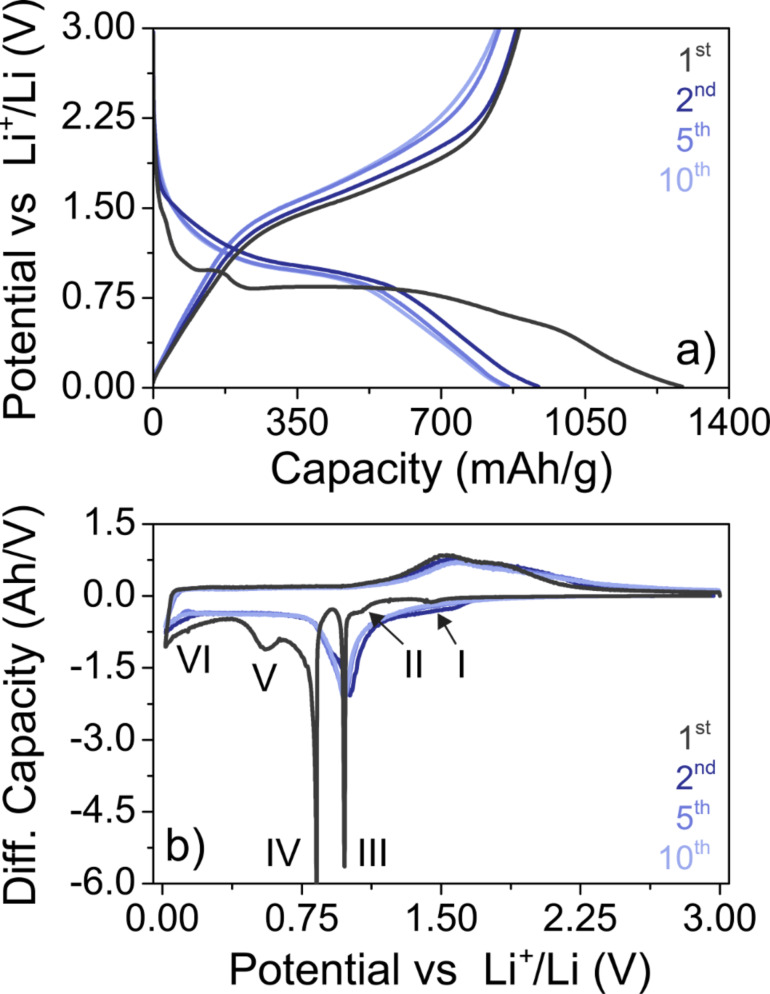
Figure 8.
(a) Charge/discharge profiles and (b) corresponding differential capacity curves of ZFO nanoparticle electrodes in Li half-cells. The first two cycles were performed at C/20 and then the rate was increased to C/10 for the subsequent cycles. The Roman numbers in (b) indicate different electrochemical reactions in the initial cycle.

