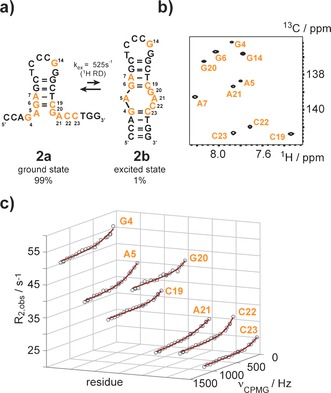
Figure 3.

Excited state of the cTAR DNA probed by 1H relaxation dispersion NMR. a) The 26 nt cTAR DNA fluctuates between state 2 a and a fully folded state 2 b. The 13C and/or 2H modified residues are highlighted in orange. b) 1H‐13C‐HSQC spectrum of site‐specifically isotope modified cTAR DNA. c) Non flat 1H relaxation dispersion profiles of residues G4, A5, C19, G20, A21, C22 and C23 acquired at 600 MHz proton resonance frequency and 25 °C.The black open circles represent the experimental data, the red line the best fit. A global fit gave an exchange rate of 525±59 s−1 and an excited state population of 1.0±0.1 %.
