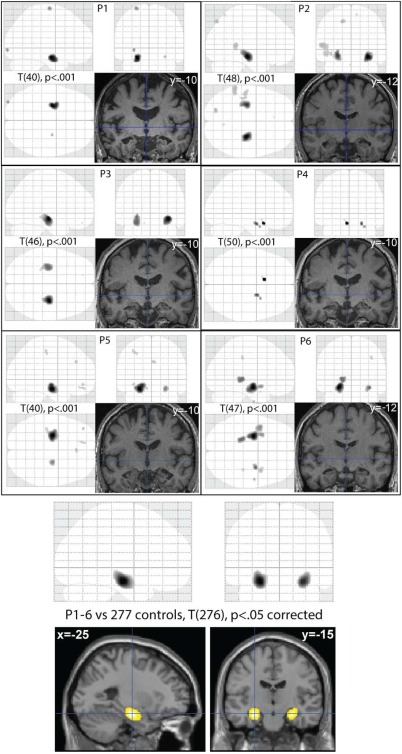
Figure 1.

Top 6 panels show VBM results for each patient (P1–P6), P < 0.001 uncorrected for a T‐contrast testing for greater GMV in controls than patients (control groups individually matched to age and sex of patients, as in Table 1). Upper images in each panel are maximal intensity projections (MIPs) from three orthogonal views; bottom‐right image in each panel is a section through the normalized T1‐image of each patient (MNI y‐coordinate of coronal section given). Bottom panel shows group VBM results thresholded at P < 0.05 corrected, rendered on a T1‐weighted image of a canonical brain. [Color figure can be viewed at wileyonlinelibrary.com.]
