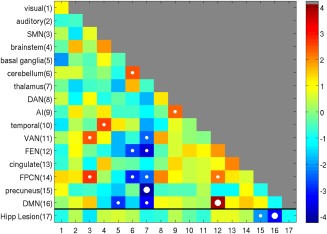
Figure 3.

A network‐by‐network matrix of differences (T‐values) in functional connectivity between control and patient groups using the 16 canonical networks defined by Geerligs et al (2015), with addition of Hippocampal lesion site in current patients. Values on the leading diagonal reflect differences in within‐network connectivity; off‐diagonal values reflect differences in between‐network connectivity. Small white circles indicate significant differences between groups of P < 0.05, while large circles indicate those P values that survive Bonferroni correction. Color bar shows T values. SMN, somatomotor network; DMN, default mode network; DAN, dorsal attention network; AI, anterior insula network; VAN, ventral attention network; FEN, frontoexecutive network; FPCN, frontoparietal control network; Hipp, hippocampus. [Color figure can be viewed at wileyonlinelibrary.com.]
