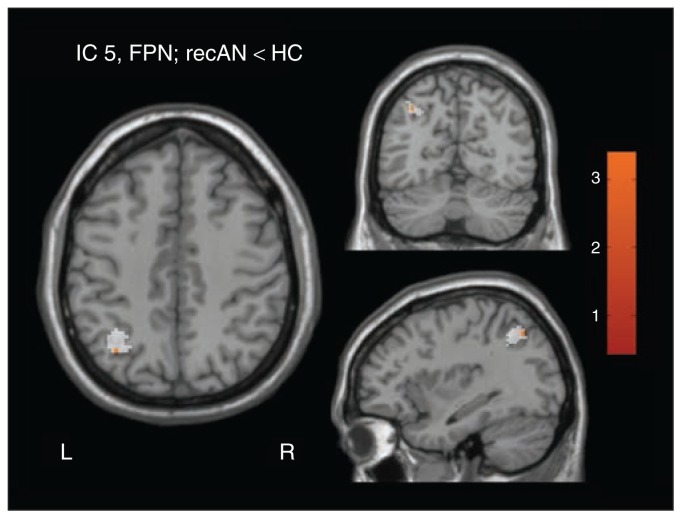
Fig. 3.
Targeted follow-up approach: group difference at a threshold of p = 0.05, familiy-wise error–corrected, between patients recovered from anorexia nervosa (recAN) and healthy controls (HC) in component 5, representing the frontoparietal network (FPN; peak coordinates in Montreal Neurological Institute space: x, y, z = 36, −64, 44). Applied mask covering the previous finding at angular gyrus (AG) is displayed in white.

