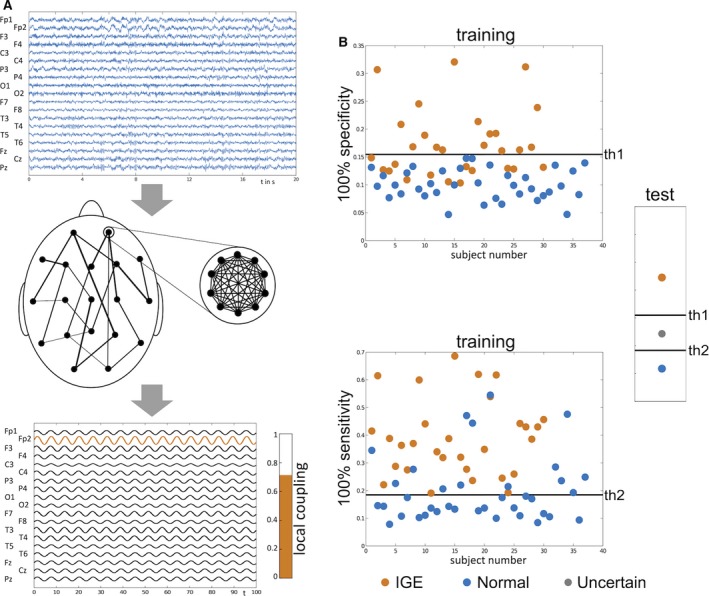
Figure 1.

Schematic of acquiring the local coupling biomarker and illustrative performance assessment. (A) The local coupling biomarker, which was identified as the best performing biomarker in this study, is acquired by inferring the global (between‐channel) network structure and the local (within‐channel) coupling strength from resting‐state EEG (top panel), and incorporating them into an oscillator model. In this scenario, each node within the network corresponds to an EEG channel (middle panel). The biomarker is quantified by placing each node within the model into a state of synchrony (by increasing its internal coupling strength beyond a threshold), and the level of emergent synchrony across the whole network is calculated (bottom panel). This level of synchrony across the network is the model proxy for seizures, which might be thought of as a “seizure likelihood.” This biomarker depends on channel location and model parameters, and thus we can perform procedures to optimize its performance. (B) To assess the performance of this biomarker as a classifier, we use the leave‐one‐out approach, in which one subject is left aside, and test subject and all other subjects form the training set on which parameters are optimized. This optimization process results in a threshold for the biomarker (th1) that yields the highest level of sensitivity at 100% specificity and another optimized set of parameters and threshold (th2) that yields the highest level of specificity at 100% sensitivity. This is illustrated for a single realization of the leave‐one‐out approach in the top and bottom panels. These thresholds are then applied to the test subject, where the outcome will be “IGE,” “normal,” or “uncertain” depending on where the value of the biomarker for the test subject lies.
