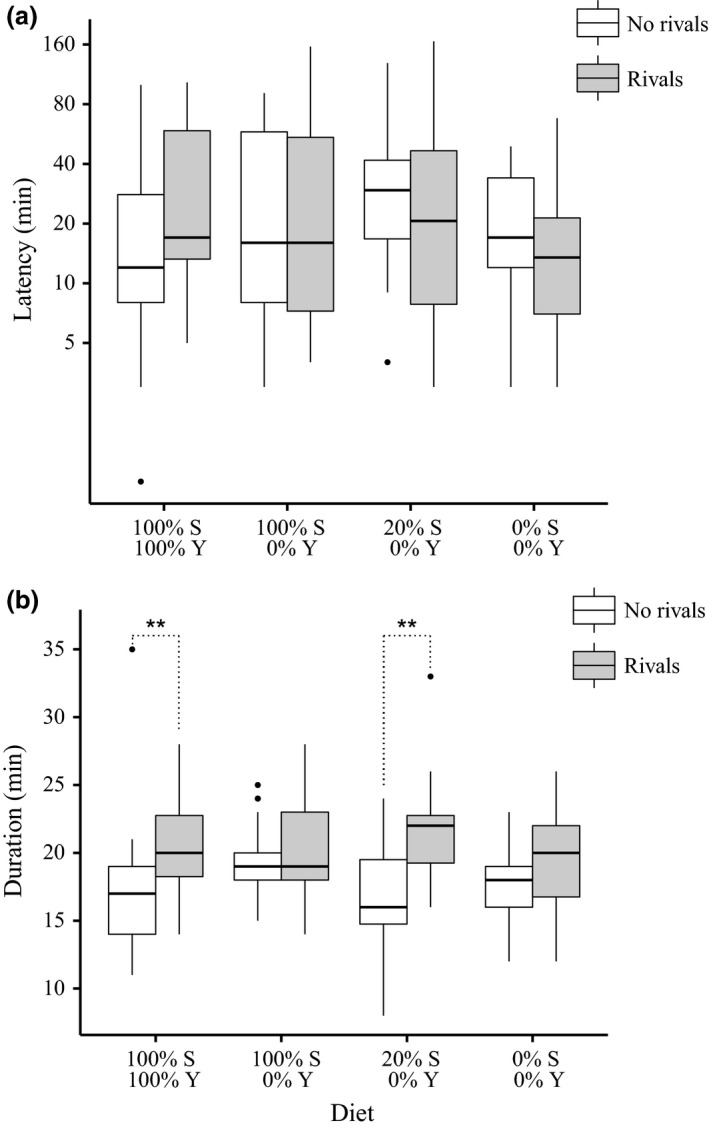
Figure 2.

Experiment 2: Mating responses to rivals under varying sucrose (S) with yeast (Y) held at zero. (a) Boxplots of mating latency (plotted on logarithmic scale) as a function of diet and male rival presence. Final latency sample sizes for ‘no rivals’, ‘rivals’ males were 100% S: 100% Y = 25, 26; 100% S: 0% Y = 25, 26; 20% S: 0% Y = 16, 18; 0% S: 0% Y = 17, 20. (b) Boxplots of mating duration as a function of diet and male rival presence. Final duration sample sizes for ‘no rivals’, ‘rivals’ males were 100% S: 100% Y = 25, 26; 100% S: 0% Y = 25, 26; 20% S: 0% Y = 16, 18; 0% S: 0% Y = 16, 20. Boxplots as in Fig. 1. Significant planned contrasts: *P < 0.05, **P < 0.01.
