Figure 5.

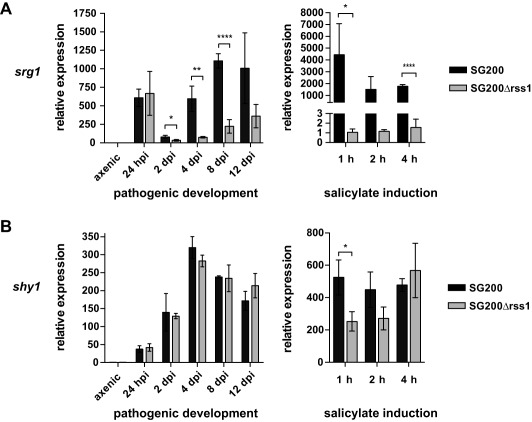
Transcriptional induction of SA‐responsive genes during pathogenic development and during growth in SA supplemented medium does not exclusively depend on Rss1. Transcript levels of the previously identified SA‐responsive genes srg1 (A) and shy1 (B) were quantified in SG200 and SG200Δrss1 by real time PCR. RNA was isolated from the indicated life cycle stages of pathogenic development (‘pathogenic development’, left panel) and from a time course after shift to YNB‐N medium containing 2% glucose and 10 mM salicylate (‘salicylate induction’, right panel). Constitutively expressed peptidyl‐prolyl isomerase transcript levels (ppi) were used for normalization. Transcript levels of the indicated genes were either compared to levels in axenic culture grown in YEPSlight medium (left panel) or grown in YNB‐N medium with 2% glucose (right panel). Expression levels in axenic culture (left panel) or in cultures grown in YNB‐N with glucose (right panel) were set to 1.0. Error bars depict standard deviation calculated from three independent biological replicates (n = 3). Significance was calculated with unpaired t test comparing transcript levels of indicated genes in SG200 with those in SG200Δrss1, * P ≤ 0.05, ** P ≤ 0.01, *** P ≤ 0.001. For transcriptional profiling of different life cycle stages, RNA extracted from twelve infected plants per time point and replicate was used.
