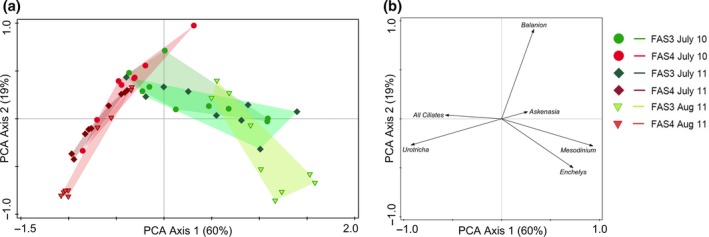
Figure 2.

Principal component analyses (PCA) of the ciliate communities (based on abundance data) for the glacial turbid Lake FAS 3 and the clear Lake FAS 4. Percentages indicate amount explained by the individual PCA axes. (a) Ordination of the samples; (b) ordination of the species.
