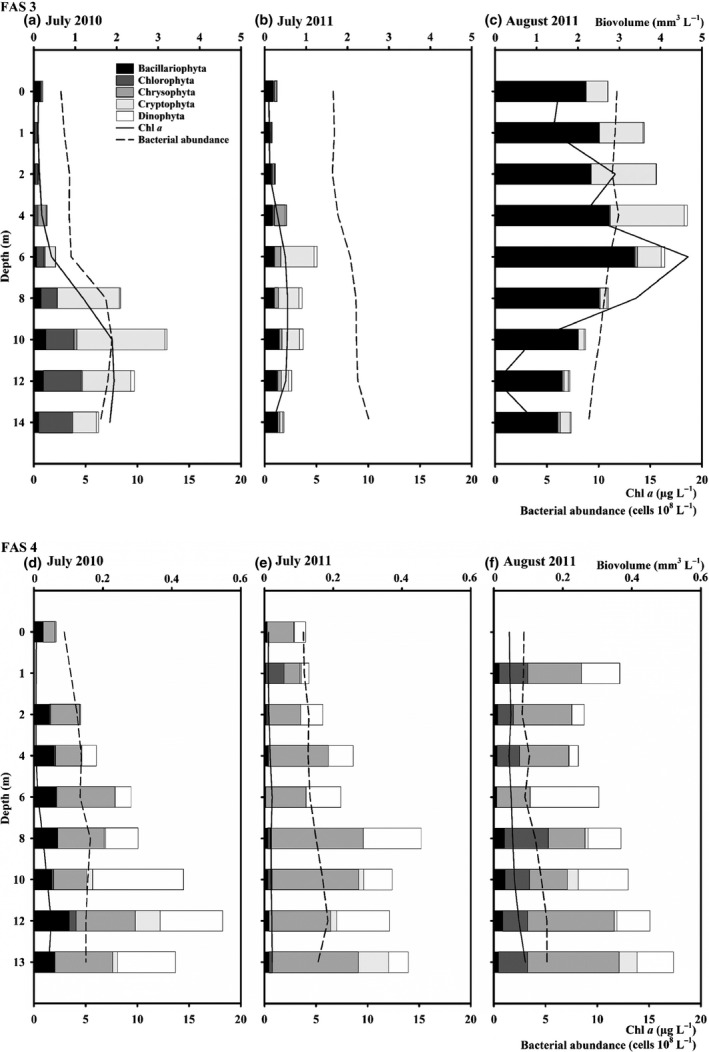
Figure 6.

(a–f) Vertical distribution of the phytoplankton (biovolume of Bacillario‐, Chloro‐, Chryso‐, Crypto‐ and Dinophyta), chlorophyll a (chl a) and bacterial abundance in the glacial turbid Lake FAS 3 (a–c) and the clear Lake FAS 4 (d–f) during the ice‐free periods of 2010 and 2011. Note the different scale bars between sampling sites.
