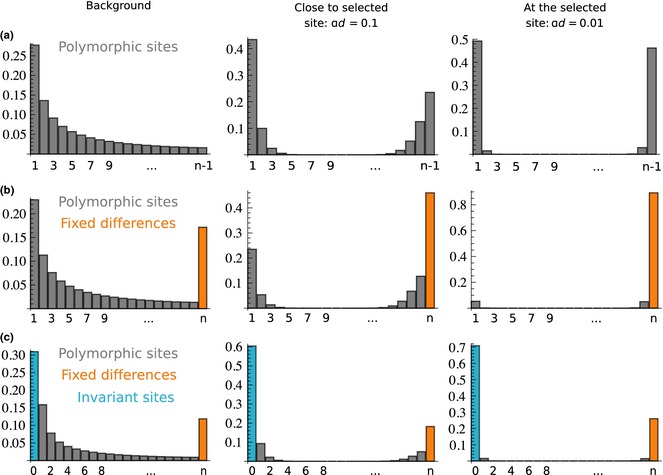
Figure 1.

Effects of a selective sweep on the expected site frequency spectrum (SFS). The horizontal axis of each plot shows the derived allele frequency in a sample of size n = 20; the vertical axis shows the proportion of sites with that frequency. (a) The expected SFS of a standard neutral background and of a neutral site linked to a selective sweep, assuming different distances between the neutral site and the sweep locus. (b) The same expectations for a SFS that is extended to include the class of fixed differences (sites that are invariant in the sample, but different to an out‐group species). (c) The same expectations for a SFS that is extended for the class of fixed differences and invariant sites that do not differ from the out‐group species. All expectations are calculated with the formulas in Nielsen et al. (2005).
