
Figure 3.
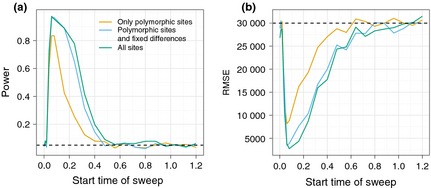
Power and accuracy comparison of the CLR tests. The power of the selection tests (a) and the root‐mean‐square error (RMSE) of the estimated location of the sweep (b) is shown as a function of the time since introduction of the beneficial mutation into the population in 2N e generations (x‐axis). The dashed line in (a) indicates the 5% significance level assumed in the power calculations, and in (b), it indicates the RMSE in case of random (uniform) localization of the sweep position. RMSE is calculated as the standard deviation of estimated minus true position in bp. Each 100 kb simulated region is scored significant if it contains at least one significant outlier CLR at the 5% level.