Figure 1.

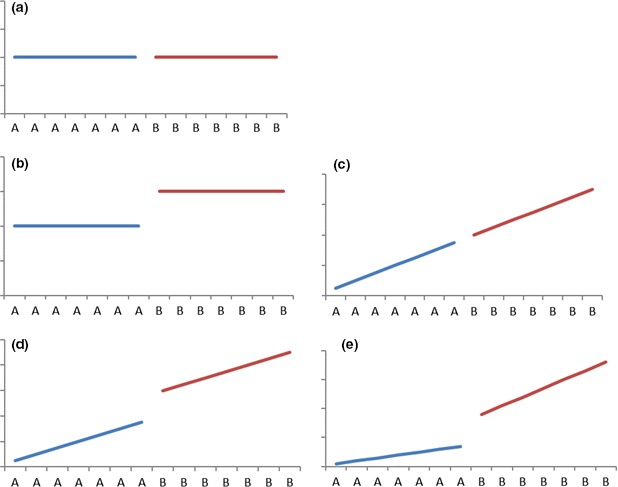
Patterns of mean behaviour. ‘A’ (blue line) and ‘B’ (red line) refer to a phase without an intervention and with an intervention, respectively. [Colour figure can be viewed at www.online library.com].

Patterns of mean behaviour. ‘A’ (blue line) and ‘B’ (red line) refer to a phase without an intervention and with an intervention, respectively. [Colour figure can be viewed at www.online library.com].