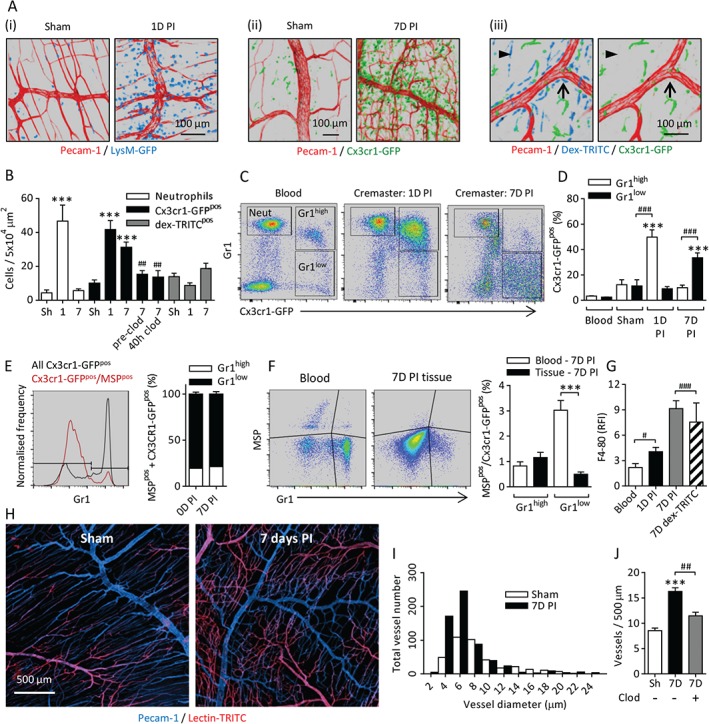
Figure 1.

Prolonged ischaemia induces acute and chronic inflammatory responses and angiogenesis. Chronic ischaemia was induced in cremaster muscles by cauterizing the primary vessels perfusing the tissue. (A) Leukocyte populations were analysed in sham tissues and at 1 or 7 days PI with (i) LysM‐GFP and (ii) Cx3cr1‐GFP mice to visualize neutrophils and monocytes, respectively. (iii) Topical application (intrascrotal) of fluorescent dextran‐TRITC (dex‐TRITC) was used to visualize phagocytic cells in CX3CR‐1GFPpos mice. The images show dex‐TRITCpos/Cx3cr1‐GFPneg cells in perivascular (arrow) and non‐perivascular (arrowhead) locations in naive tissues. The vasculature was fluorescently labelled with anti‐PECAM‐1 antibody. (B) Quantification of neutrophils, Cx3cr1‐GFPpos and Cx3cr1‐GFPneg/dex‐TRITCpos cells in sham (Sh), 1‐day or 7‐day PI tissues. In some cases, circulating monocytes were depleted with clodronate (clod) liposomes (intravenous) before or 40 h after surgery. (C) Blood and cremaster muscles were collected from naive and 1‐day or 7‐day PI mice. Cremaster muscles were enzymatically digested, and cells were fluorescently labelled with antibodies against CD45 and Gr1 (clone RB6‐8C5) and 4′,6‐diamidino‐2‐phenylindole (DAPI) to identify live leukocytes (supplementary material, Figure S2i). Examples of leukocyte populations from blood and digested cremasteric tissues are shown. (D) Frequency of Cx3cr1‐GFPpos/Gr1high or Gr1low cells as a proportion of total CD45pos leukocytes. (E) Analysis of blood after intravenous injection of fluorescent MSP. The histogram shows the frequencies of Gr1high and Gr1low monocytes in the circulation (black line), and the normalized frequency of MSP‐labelled monocytes. The graph shows Gr1high or Gr1low expression among all Cx3cr1‐GFPpos/MSPpos cells. (F) Example scatterplots and quantification of MSP labelling of Cx3cr1‐GFPpos cells in blood and 7‐day PI tissue after digestion. The graph shows the frequencies of MSPpos Gr1high and Gr1low cells in blood and tissues 7 days PI (see supplementary material, Figure S2ii, for the full gating strategy) (G) F4/80 expression on Cx3cr1‐GFPpos/Gr1low and dex‐TRITCpos cells in blood and cremaster digests at 1 and 7 days PI, quantified relative to an isotype control (supplementary material, Figure S2i, iii). (H) Examples of sham or 7‐day PI tissues labelled with topical anti‐PECAM‐1 antibody to visualize venules and capillaries, with less intense labelling of arterioles, and lectin‐TRITC (intravenous) to visualize arterial vessels and capillaries, with less intense labelling of venules. (I) Frequency histogram of vessel diameters in 12 images of sham and PI tissues. (J) Circulating monocytes were depleted with clodronate liposomes (intravenous) prior to surgery. The frequency of vessels was quantified in sham, PI and monocyte‐depleted 7‐day PI tissues. n = 5–15 animals per group. Data are presented as mean ± SEM, and statistically significant (t‐test) differences between sham and PI groups or blood and tissues are indicated by asterisks: *p < 0.05, **p < 0.01, and ***p < 0.001. Differences between control and monocyte‐depleted groups, cell subsets or time points are indicated by hash symbols: # p < 0.05, ## p < 0.01, and ### p < 0.001.
