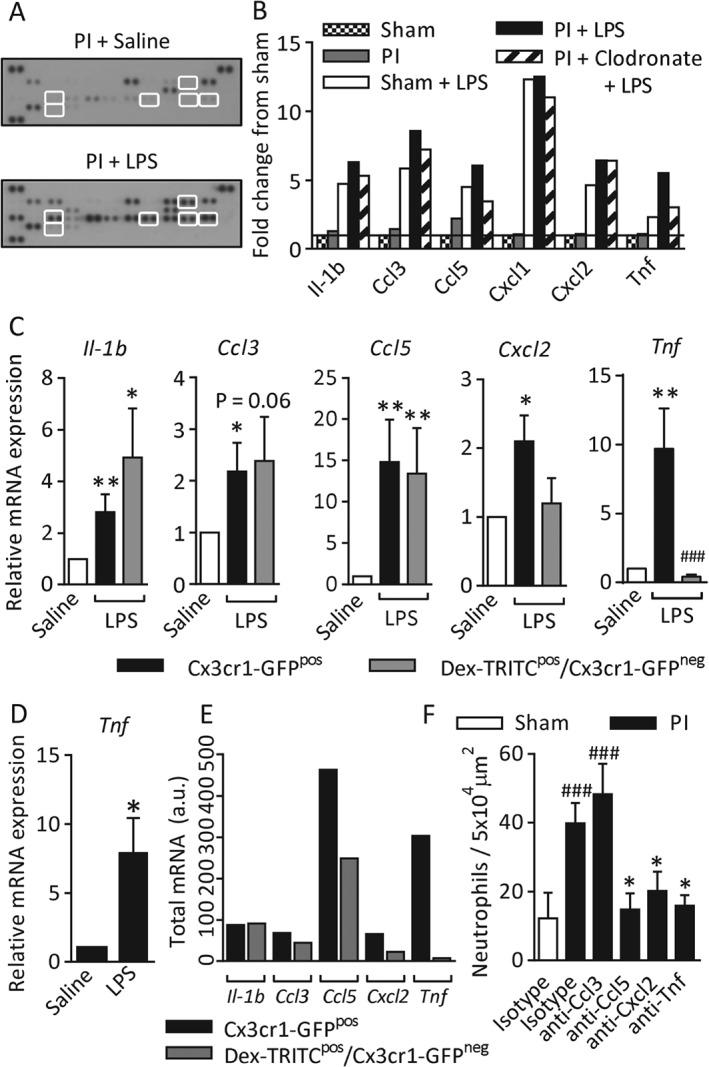
Figure 3.

Acute LPS stimulation of Gr1low MDCs induces the generation of proinflammatory signals. Chronic ischaemia was induced in the cremaster muscles of WT mice. Some tissues were monocyte/macrophage‐depleted with clodronate liposomes (i.s.), and circulating neutrophils were depleted with anti‐Ly6G antibody (clone 1A8). On day 7, cremaster muscles were acutely stimulated with LPS (300 ng, i.s., 4 h) or saline. Tissues were collected, homogenized, and analysed by use of a chemokine/cytokine array immunoblot. (A) Examples of an unstimulated blot and an LPS‐stimulated blot. Highlighted spots are the mediators shown in (B). (B) Intensity data were analysed for mediators that conformed to certain parameters: (1) known to recruit neutrophils; (2) elevated by LPS stimulation; (3) higher levels in PI than in sham tissues; and (4) reduced in monocyte/macrophage‐depleted tissues. Data are normalized to the fold difference from unstimulated sham tissues. n = 2 animals pooled per blot, two blots (n = 4 animals) per treatment group (see supplementary material, Table S1, for the complete dataset). (C) Seven‐day PI cremaster muscles from Cx3cr1‐GFP mice were stimulated with LPS or saline, and phagocytic cells were labelled with TRITC‐dextran (i.s.) in vivo. Tissues were digested enzymatically, and labelled with anti‐CD45 and 4′,6‐diamidino‐2‐phenylindole (DAPI) to identify live leukocytes. CD45pos/DAPIneg/Cx3cr1‐GFPpos cells (which have a variable level of dextran‐TRITC intensity) and DAPIneg/CD45pos/dextran‐TRITCpos/Cx3cr1‐GFPneg cells were purified by fluorescence‐activated cell sorting (see supplementary material, Figure S2, for the full gating strategy). Purified cell populations were analysed by RT‐qPCR for Il‐1b, Ccl3, Ccl5, Cxcl2 and Tnf mRNA. Data were normalized to the glyceraldehyde‐3‐phosphate dehydrogenase gene, and are shown as the fold difference between LPS‐stimulated cells (black and grey bars) and unstimulated samples of each cell type (white bars). (D) The Cx3cr1‐GFPpos/Gr1low population was selectively purified from saline and LPS‐stimulated tissues, and Tnf mRNA was quantified. (E) The frequency of dextran‐TRITCpos/Cx3cr1‐GFPneg and Cx3cr1‐GFPpos cells (from Figure 1B) was multiplied by the expression level of each mediator to visualize the total inflammatory contribution of each cell population. (F) Sham or 7‐day PI tissues were treated with blocking antibodies against Ccl3, Ccl5, Cxcl2 or TNF (10–20 µg) co‐administered with LPS (300 ng, i.s., 4 h). Tissues were collected and labelled with fluorescent antibodies against PECAM‐1 and S100A9, and neutrophil extravasation was quantified. n = 3–11 animals per group. Data are presented as mean ± SEM, and statistically significant (t‐test) differences between saline and LPS‐stimulated groups, or between isotype control and blocking antibody groups, are indicated by asterisks: *p < 0.05, **p < 0.01, and ***p < 0.001. Differences between sham and PI tissues or between Cx3cr1‐GFPpos cells and dextran‐TRITCpos/Cx3cr1‐GFPneg cells are indicated by hash symbols: # p < 0.05.
