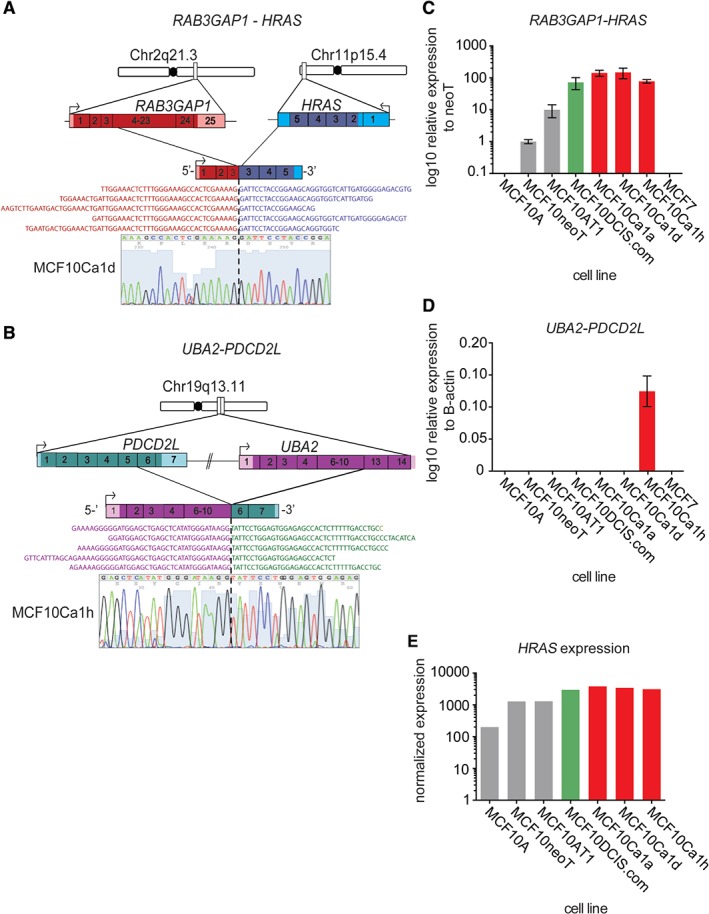
Figure 2.

Identification of expressed fusion genes in the MCF10 progression series. (A) Cartoon representation of genomic location, orientation and architecture of the expressed RAB3GAP1–HRAS fusion gene. Representative RNA sequencing reads spanning the fusion are also displayed. The RT‐qPCR product was Sanger‐sequenced; confirming the fusion junction, and a representative chromatogram from MCF10Ca1d cells is shown. (B) Cartoon representation of genomic location, orientation and architecture of the expressed UBA2–PDCD2L fusion gene. Representative RNA sequencing reads spanning the fusion are also displayed. The RT‐qPCR product was Sanger‐sequenced, confirming the fusion junction, and a representative chromatogram from MCF10Ca1h cells is shown. (C) Bar plot showing relative expression of the RAB3GAP1–HRAS fusion gene in the MCF10 progression series detected by RT‐qPCR. (D) Bar plot showing relative expression of the UBA2–PDCD2L fusion gene in the MCF10 progression series detected by RT‐qPCR (E) Bar plot of normalized reads of HRAS in the MCF10 progression series from RNA sequencing.
