Figure 3.

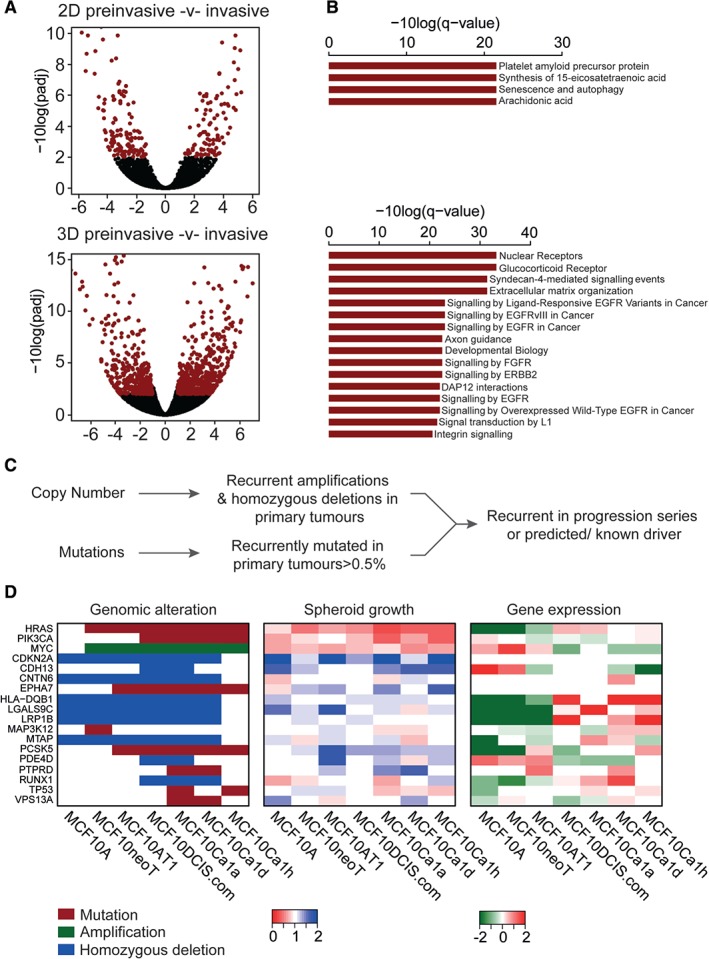
Evaluation of pathways and driver alterations in spheroid cultures. (A) Volcano plots showing the differentially expressed transcripts between preinvasive and invasive cells from the MCF10 progression series cultured under both 2D and 3D conditions. Red: FDR p‐values of <0.01. (B) Bar plot showing the significantly over‐represented pathways (ConsensusDb q‐value of <0.01) from (A). (C) Schematic of gene selection for the siRNA screen. (D) Matched heatmaps of genomic status (mutation, amplification, and homozygous deletion); results of spheroid growth after siRNA‐mediated silencing and gene expression. Relative spheroid growth was measured according to the survival fraction of treated cells relative to siControl. Hits were triaged as a relative survival fraction as compared with non‐targeting control of <0.8 or >1.2. Gene expression is the log2 median centred normalized reads from the RNA sequencing data.
