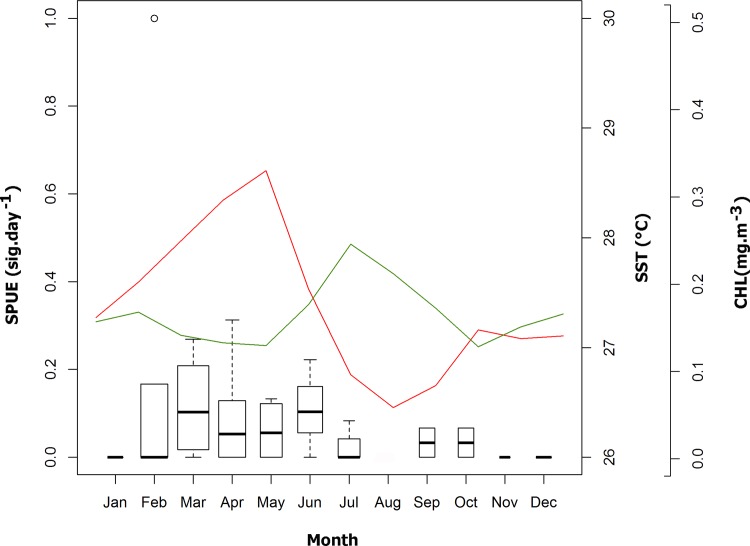
Fig 4. Primary productivity and sea surface temperature of ASPSP surroundings.
Sighting per Unit of Effort (SPUE) in relation to sea surface temperature (SST; red line) and chlorophyll a concentration (CHL; green line) satellite image composites, from January 2005 to December 2014 for a ~100 km2 area around the ASPSP. The width of the boxes is proportional to the square-roots of the number of observations in the groups, the horizontal bar is the median and the open circle indicates a single outlier.

