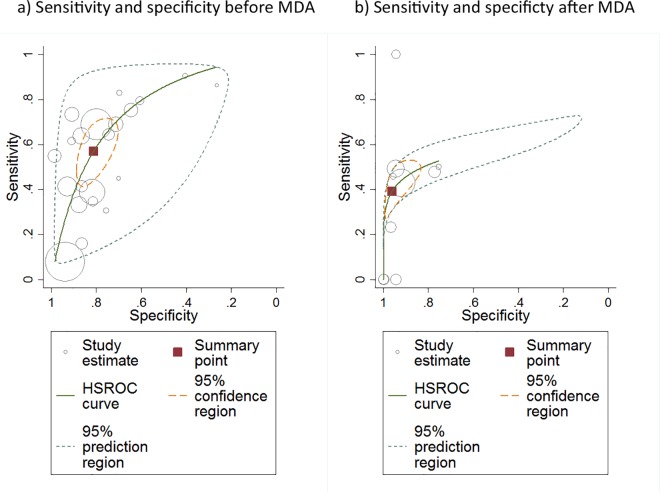
Fig 5.
Sensitivity versus specificity of each study, using TF to diagnose C. trachomatis infection at the individual level (a) before and (b) after the introduction of MDA. Each circle represents the estimate for a single study, with the size of the circle representing the size of the study. The red square is the estimated pooled sensitivity and specificity for all studies (Pre- or Post-MDA). The orange dashed line represents the 95% CI (or confidence region in 2 dimensions) for the sensitivity and specificity. The grey curve (hierarchical summary receiver operating characteristic (HSROC) curve) represents the estimated relationship between sensitivity and specificity in these studies, with the grey dashed line indicating the region in which we would expect 95% of studies to fall.

