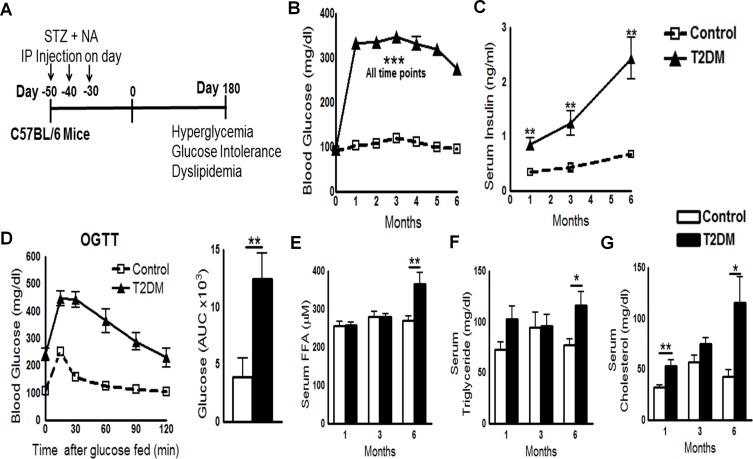
Fig 1. Development of a mouse model of T2DM.
A. Schematic representation of T2DM induction in C57BL/6 mice. B. Random blood glucose sampling at monthly intervals for up to 6 months. Data were pooled from three independent experiments (n = 5 mice per group per experiment). C. Serum insulin levels were measured by ELISA at 1, 3, and 6 months. D. An oral glucose tolerance test (OGTT) was performed at 6 months post-T2DM induction (left panel). Blood glucose concentrations and the area under the curve are shown (right panel). E to G. Serum cholesterol, triglyceride, and free fatty acid levels at 1, 3, and 6 months post-induction of T2DM. C to G. Data are representative of two independent experiments (n = 5 mice per group per experiment). *P < 0.05, **P < 0.01, and ***P < 0.001.

