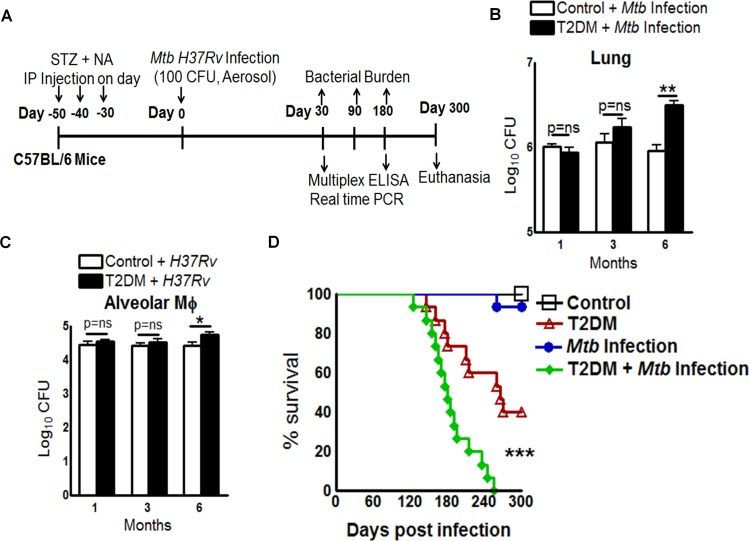
Fig 2. Type 2 diabetes increases the bacterial burden and reduces survival of Mtb-infected mice.
A. Schematic representation of T2DM induction and Mtb infection. B. Bacterial burden in lungs at 1, 3, and 6 months p.i. Data are representative of two independent experiments (n = 5 mice per group). C. Alveolar macrophages from control and T2DM mice (at 1, 3, and 6 months after the induction of diabetes) were infected with Mtb at a MOI of 1:2.5. After 2 h, macrophages were washed to remove extracellular bacteria and cultured. After 5 days, intracellular Mtb levels were measured. Data points represent the mean value of three independent experiments. Pooled lung alveolar macrophages from two mice per group per time point were used for each independent experiment. D. Survival curves for control (black square), T2DM (red triangle), Mtb-infected control (blue circle), and Mtb-infected T2DM mice (green diamond). Data were pooled from two independent experiments (n = 7–8 mice per group per experiment). Survival curves were compared using the log rank test (P < 0.001). Data are expressed as the mean ± SE. *P < 0.05, **P < 0.01, and ***P < 0.001.

