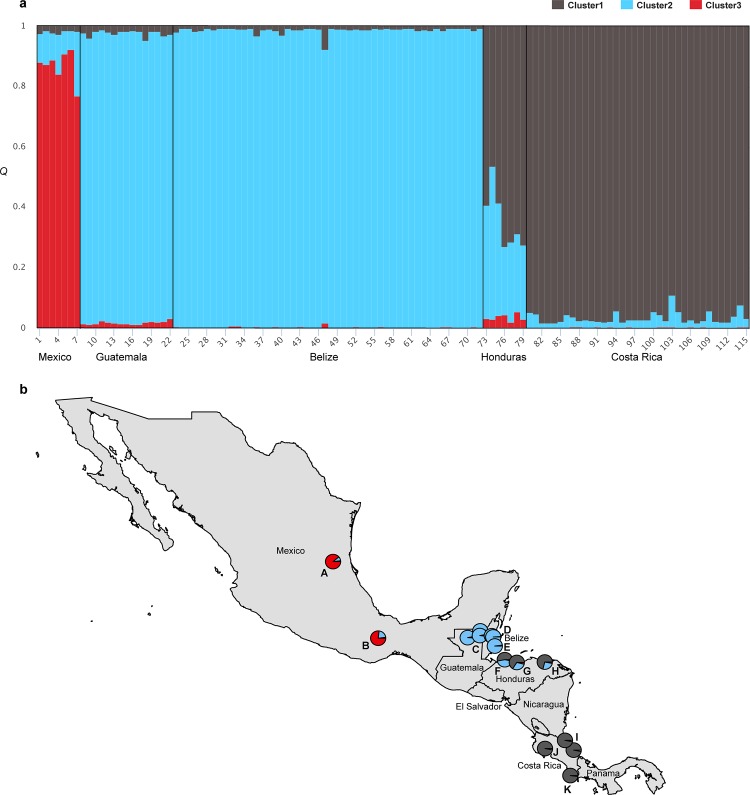
Fig 2. Genetic structure in Mesoamerican jaguars.
Results were obtained from Bayesian clustering analysis (K = 3) using STRUCTURE, version 2.3.4 [47] and genotype data from 12 microsatellite loci for jaguars (n = 115) sampled across five Mesoamerican countries (Belize, Costa Rica, Guatemala, Honduras, Mexico). (a) STRUCTURE barplot—vertical bars represent individuals and the color of each bar visualizes the % of membership (Q) the individual belongs to the genetic clusters (K) identified. (b) Pie charts represent fractions of Q for groups of jaguar individuals studied across different sampling sites (A, Sierra del Abra Tanchipa Biosphere Reserve, Mexico; B, Sierra Mixe, Oaxaca, Mexico; C, northern Guatemala [Laguna del Tigre National Park, Maya Biosphere Reserve, Mirador Río-Azul National Park]; D, Central Belize Corridor Area, Belize; E, Cockscomb Basin Wildlife Sanctuary, Belize; F, Jeanette Kawas National Park, Honduras; G, Pico Bonito National Park, Honduras; H, Río Plátano Biosphere Reserve, Honduras; I, northeastern Costa Rica [Tortuguero National Park, Barra del Colorado Wildlife Refuge, and Barbilla National Park]; J, several sites across northern and northwestern Costa Rica; K, Corcovado National Park, Costa Rica.

