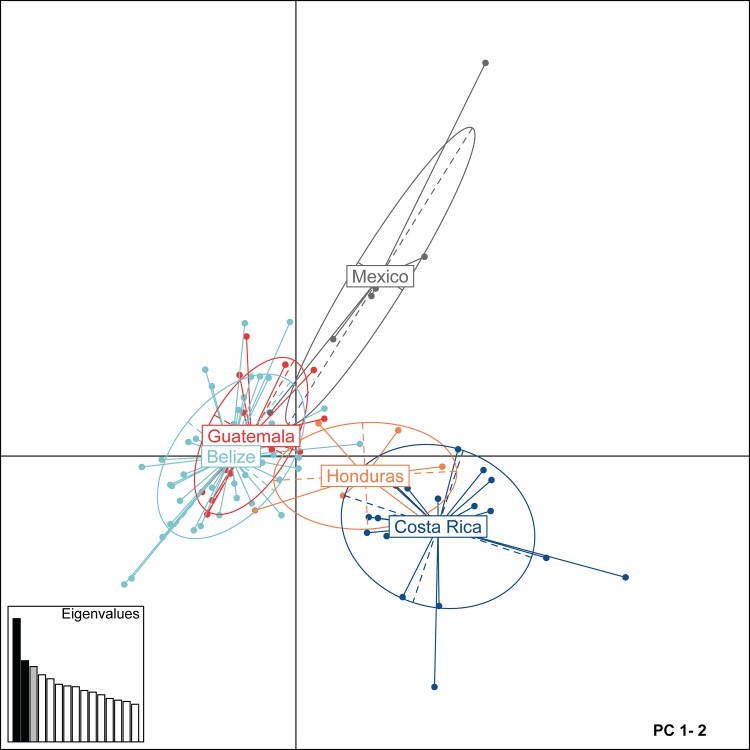
Fig 5. Principal component analysis (PCA) based on Mesoamerican jaguar genotypes.
Scatterplot visualizes the first two principal components. Points represent individual genotypes, and geographical groups of jaguars sampled across five Mesoamerican countries (Belize, Costa Rica, Guatemala, Honduras, Mexico) are 95% inertia ellipses in different colors. Inserted barchart shows eigenvalues with corresponding components in dark grey. PC, principal component.

