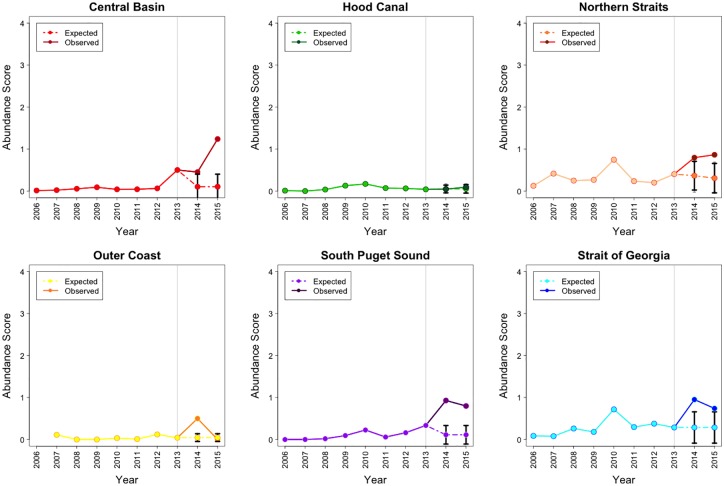
Fig 8. The actual 2006–15 and projected 2014–15 abundance for S. droebachiensis in 5 basins of the Salish Sea and the Outer Coast.
Grey line marks the epidemic onset. Note: Abundance = Density Score x SF, where Density Score = [(nSx1)+(nFx2)+(nMx3)+(nAx4)] / (nS + nF + nM + nA). Here nS, nF, nM, and nA represent the number of times each abundance category was assigned for a given species.

