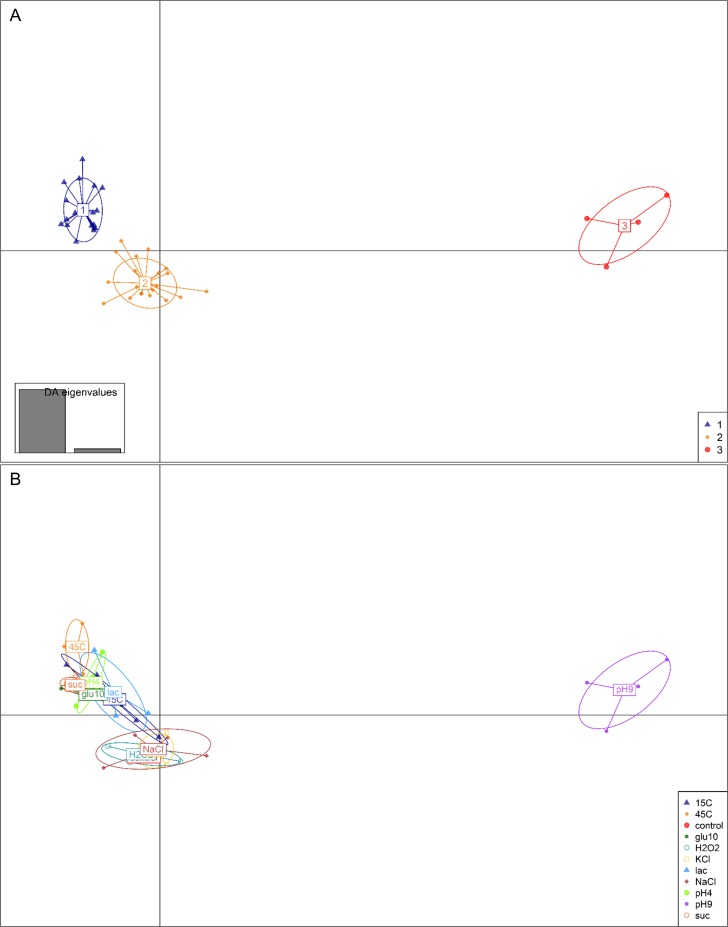
Fig 3. The DAPC analysis performed with the ‘adegenet’ package for the R software, displayed as a scatterplot of the first 2 principle components.
477 MALDI-TOF mass spectra were considered. (A) Optimal clusters defined by ‘find.clusters’. (B) Data labelled according to induced sublethal stress conditions.

