Figure 5.

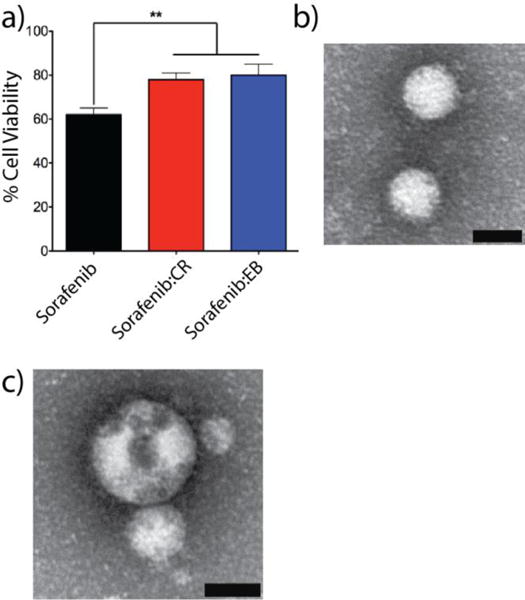
a) In vitro assessment of co-aggregated formulations sorafenib:CR (red bars) and sorafenib:EB (blue bars, 1:1, 50 μM each) with MDA-MB-231 cells reveals significantly less cytotoxicity compared to sorafenib colloids alone (black bars) (n = 3 independent measurements, mean ± SD, ** denotes p < 0.01). Representative TEM fields of view for b) sorafenib:CR and c) sorafenib:EB (1:1, 50 μM each, PBS) obtained after incubation in BSA (4 mg/mL, PBS, 4h, 37 °C). Scale bars are 50 nm.
