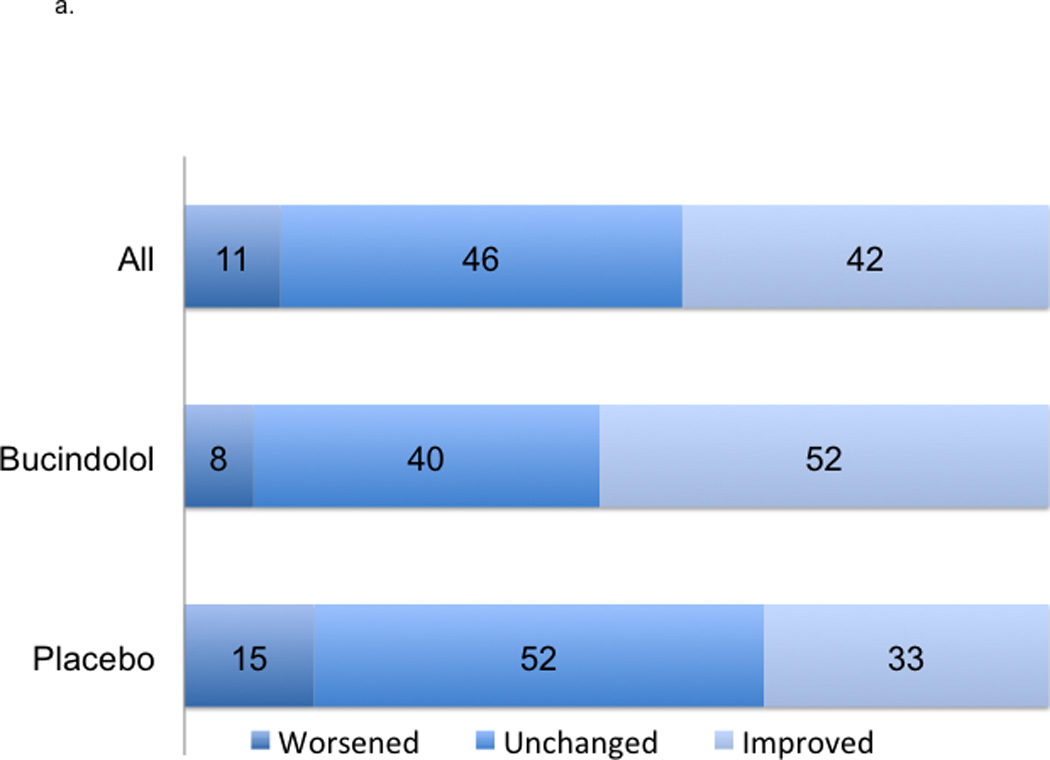
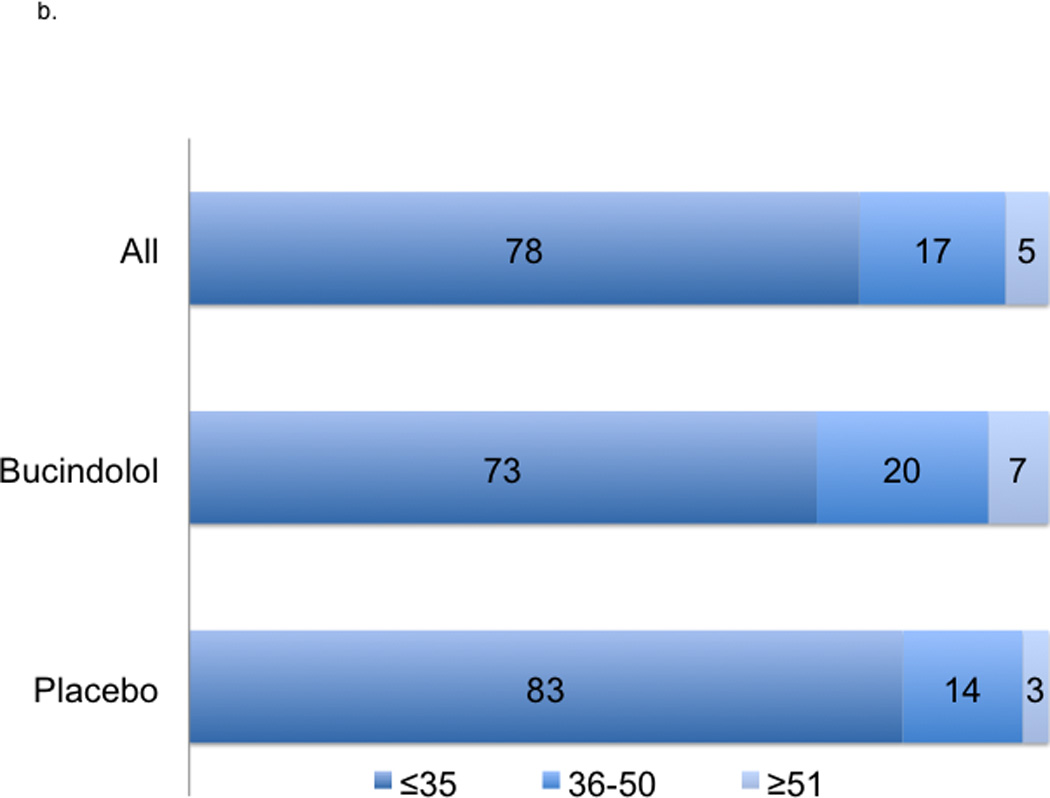
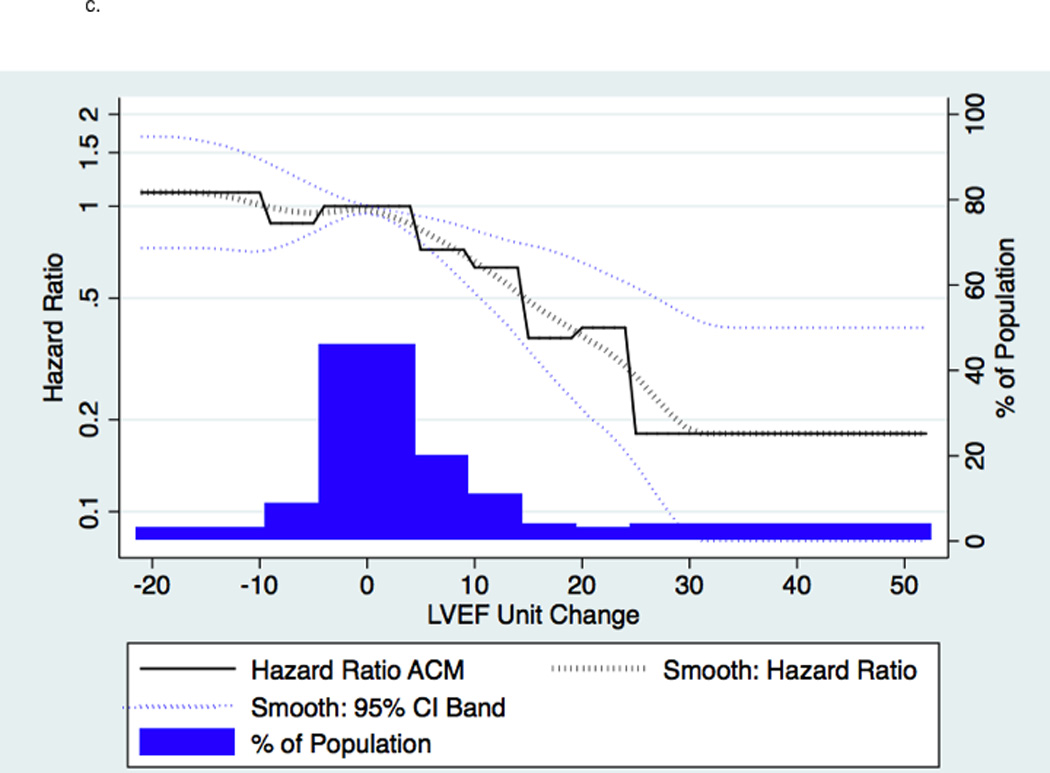
Figure 2. Change in 12-Month LVEF and Risk of ACM.


2a indicates absolute changes with treatment at 12-month; worsened, ≤−5 units; unchanged, −4 to 4 units, and improved ≥5 units. 2b indicates LVEF at 12-months. 2c indicates a histogram of absolute units change in histogram and linear plot of hazard ratio of ACM based upon absolute units change in LVEF compared to unchanged LVEF; the dotted black line indicates local polynomial smoothing of the ACM hazard ratio; dotted blue lines, 95% Confidence Interval (CI) band of ACM hazard ratio with local polynomial smoothing.
