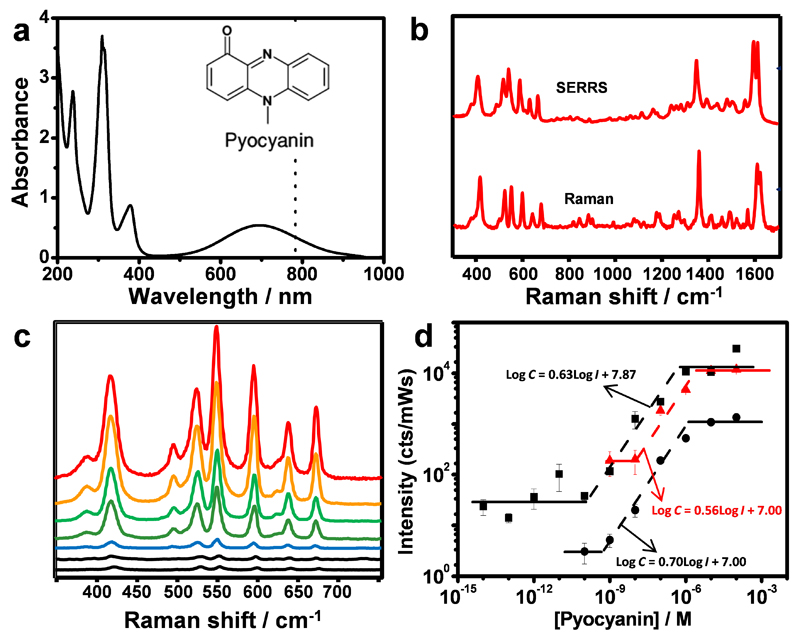
Figure 2. Raman and SERRS spectra of pyocyanin.
a) UV-vis-NIR spectrum of aqueous pyocyanin solution (10−4 M) and molecular structure of pyocyanin (inset). The dotted line indicates 785 nm, corresponding to the excitation wavelength used for Raman and SERRS spectra. b) RR and SERRS spectra of pyocyanin measured in solid state and in aqueous solution (1µM, Au@pNIPAM hydrogel), respectively. Raman measurement was carried out with a 50× objective, a maximum power of 54.22 kW/cm2 and acquisition time of 10 s. SERS measurement was carried out with a 20× objective, a maximum power of 4.24 kW/cm2 and acquisition time of 10 s. c) Pyocyanin SERRS spectra at different concentrations (between 0.1 nM and 10 µM with 10-fold increase steps), recorded on Au@pNIPAM hydrogels. SERRS measurements were carried out with a 20× objective, a maximum power between 0.26-4.24 kW/cm2 and an acquisition time of 10 s. d) SERRS intensity (at 418 cm−1 for Au@pNIPAM -circles- and Au@TiO2 -triangles; at 1600 cm−1 for micropatterned Au@SiO2 -squares) as a function of pyocyanin concentration. The dashed lines are linear fits in the quantitative detection regions. Each data point corresponds to the average signal from five spectra collected from three different substrates. An excitation laser line at 785 nm was used for all measurements. A 20× objective, a maximum power of 0.98 kW/cm2 and an acquisition time of 0.1s was used for micropatterned Au@SiO2 substrate.

