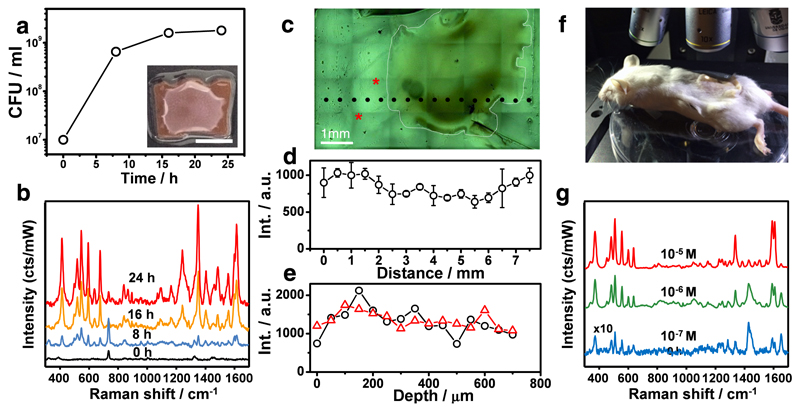
Figure 4. In situ detection of pyocyanin secreted by P. aeruginosa PA14 colony-biofilms grown on Au@pNIPAM hydrogels.
a) Graphical representation of viable bacteria (CFU/mL) quantified over time. The inset shows an image of the colony-biofilm (scale bar: 0.5 cm). b) SERRS spectra recorded at the indicated times. c) Optical microscopy image of a bacterial colony-biofilm, which is surrounded with a white striped line for clarity. d) SERRS intensities (418 cm−1) measured in Figure 4c at the places indicated with black dots and plotted as a function of distance. The error bars show the standard deviation from three different measurements. e) SERRS intensities (418 cm−1) measured in Figure 4c at the places indicated with asterisks and plotted as a function of the depth from the surface. SERRS measurements of colony-biofilms were done using 785 nm laser line for 10 s and using a maximum power of 0.91 kW/cm2 employing a 20x objective. f) Photograph showing the Raman experimental set-up for detection of pyocyanin in subcutaneous implants in mice. g) Under-skin SERRS spectra of pyocyanin spiked at the indicated concentrations on Au@pNIPAM hydrogel. SERRS measurements of pyocyanin-spiked hydrogels were performed using a 785 nm laser line for 10 s using a maximum power of 24.45 kW/cm2 employing a 10x objective.

