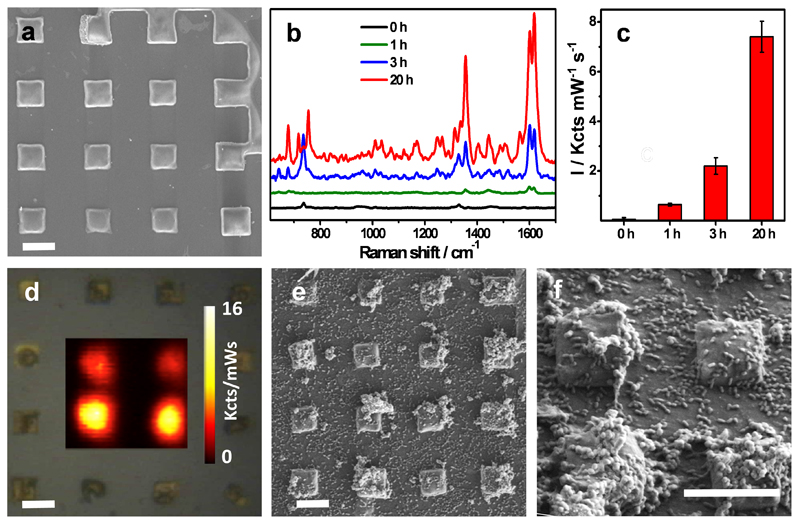
Figure 6. In situ detection and imaging of pyocyanin produced by P. aeruginosa PA14 grown on micropatterned Au@SiO2 substrates.
a) SEM images of silica-coated Au nanorod supercrystals. Scale bar: 5 μm. b) Representative SERRS spectra measured at 0, 1, 3 and 20 hours. c) Relative SERRS intensities (1600 cm−1) recorded at 0, 1, 3 and 20 hours. d) Optical image of the substrate and SERRS mapping of pyocyanin (1600 cm−1) recorded at 20 hours of growth. Scale bar: 5 μm. e,f) SEM images of silica-coated Au nanorod supercrystals colonized by P. aeruginosa (20 h) at different magnifications. Scale bar: 5 μm. All SERS measurements were carried out with a 785 nm laser line, 50× objective and a maximum power of 0.98 kW/cm2. Acquisition time was 0.1s.

