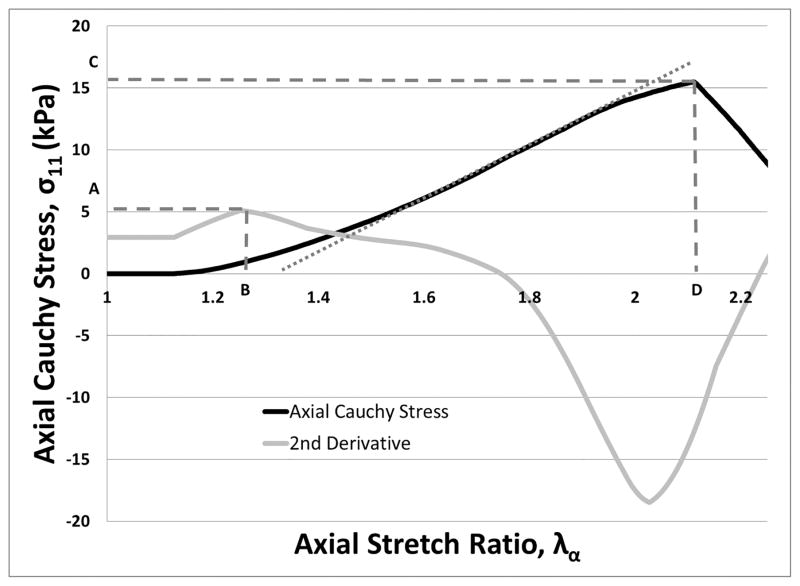
Figure 2. Features of Stress-Strain Behavior Captured by the VAA.
The black curve shows σ11 vs. λa from a sample test using 5 mg/mL fibrinogen. The gray curve is a scaled form of the second derivative of the σ11 with respect to λa. Points A and B indicate the yield stress and yield stretch, respectively. The ultimate tensile strength (UTS) and ultimate stretch are noted by points C and D, respectively. The linear portion of the black stress-strain curve is estimated by a dotted gray line. The slope of this line is the tangent modulus.

