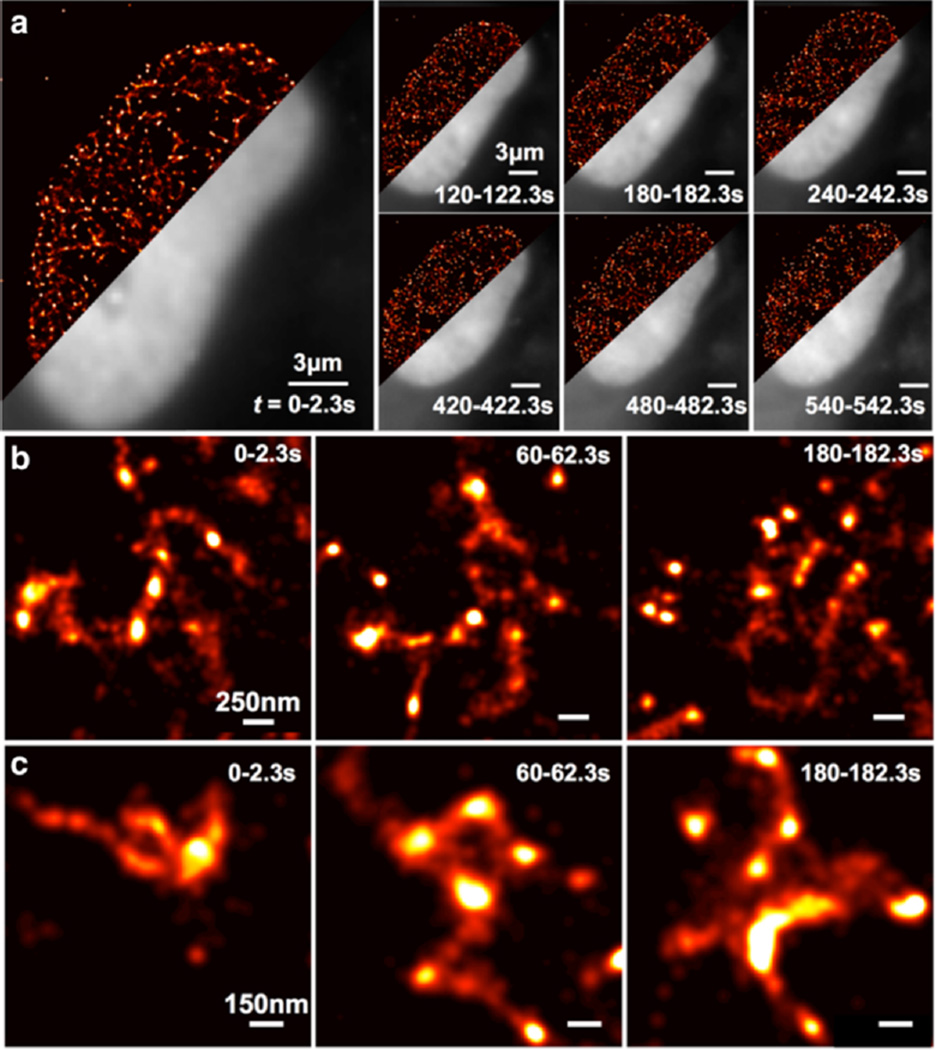
Figure 6. Super-resolution live cell imaging of the dynamics of HP1α in a Hues6 cell.
(a) Light-sheet imaging of HP1α in a living Hues6 cell with 2.3-s data acquisitions. Grey areas denote the frame-average conventional fluorescent images and the red areas denote the superresolution images of the HP1α structure. Acquisition time points are as marked. (b)–(c), High-magnification views of the temporal dynamics of the HP1α distribution at two positions within the nucleus.

