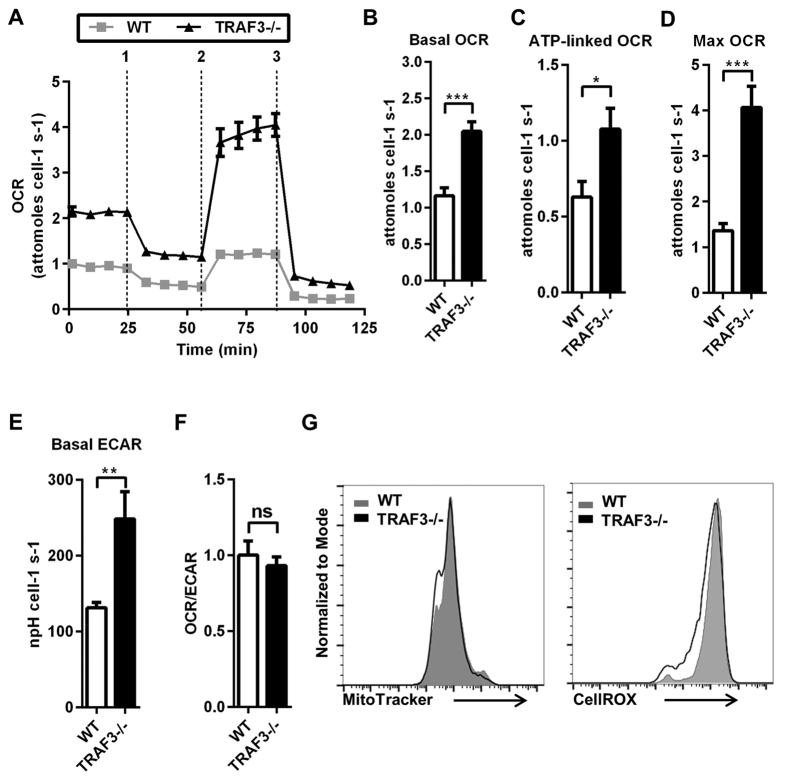
Figure 3. Metabolic consequences of B cell loss of TRAF3.
(A–G) B cells were isolated from littermate WT and B-Traf3−/− mice. (A) Representative plot of OCR over time with addition of oligomycin (1), FCCP (2) and antimycin ± rotenone (3). (B) Basal OCR was measured before the addition of oligomycin. (C) ATP-linked OCR was determined as the difference in OCR before and after addition of oligomycin. (D) Maximum OCR was measured after the addition of FCCP. (E) Basal ECAR was measured before addition of oligomycin. (F) OCR/ECAR is the ratio of basal OCR to basal ECAR. Data are from >4 independent experiments = SEM. Student’s t-test was used for statistical significance (ns = not significant, *p < 0.05, **p < 0.01, ***p < 0.001). (G) B cells were stained with MitoTracker Green or CellROX to measure mitochondrial mass and cellular ROS. Data are representative of two independent experiments.

