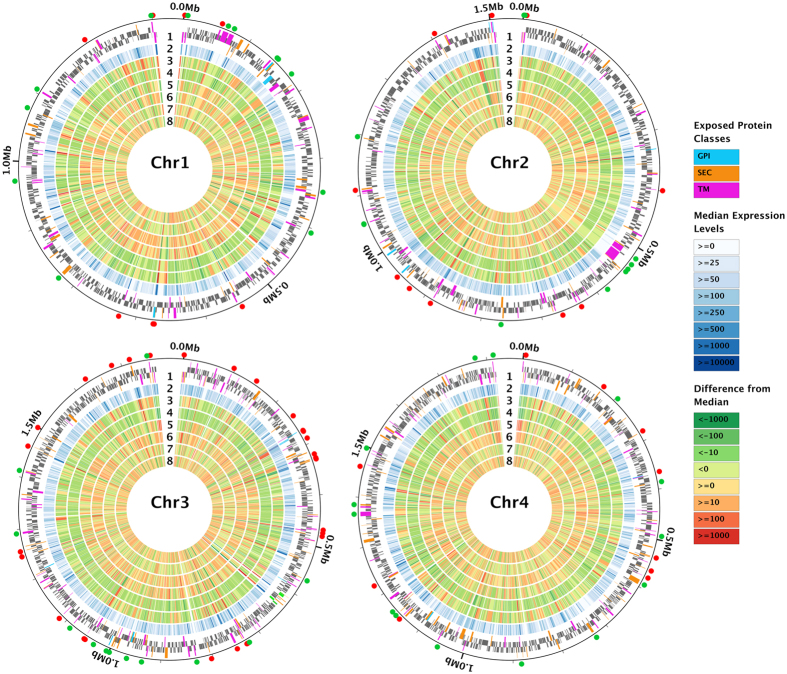
Figure 1. Gene expression profile is highly correlated among six isolates of B. microti.
Gene expression is shown for genes across the four nuclear chromosomes of B. microti. The numbered concentric circles represent the following: 1) genes encoded in the forward and reverse strands (mostly grey), with the host-exposed, secretome genes color-coded (GPI-anchored in blue; secreted proteins, SEC, in orange; transmembrane proteins, TM, in pink), and rDNA genes highlighted (in green, in chromosome 3); (2) median gene expression level, in RPKM (shades of blue); (3–8) deviation from median expression level, respectively, in GI, ATCC 30222, ATCC PRA-99, GreenwichYale_Lab_Strain_1, Nan_Hs_2011_N11_50, and Naushon. The expression of most genes is very similar across isolates, as shown by the overall low color intensity in these six most inner circles, with some notable exceptions such as the subtelomeric transmembrane-encoding genes in chromosome 1, or the GPI-anchored proteins, shown at 6 o’clock, in chromosome 1. The secretome genes that fall among the 10% most highly expressed (red) and 10% least expressed (green) genes are marked with small circles outside each chromosome plot. Approximately 25% of the secretome genes fall into one of these two classes.

