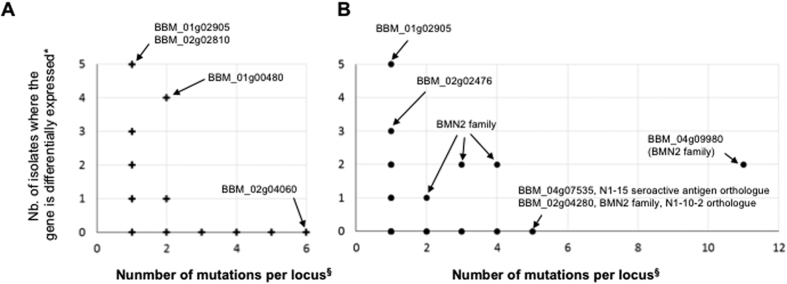
Figure 5. Comparison of expression levels of genes carrying at least one mutation.
*Number of isolates where gene expression shows a 3-fold difference from the median of the six tested isolates. §Number of mutations found in CDS, intron, 5′ UTR and 3′ UTR. (A) Loci with R1-specific mutations (n=383). (B) Loci with non-R1-specific mutations (n=105).

