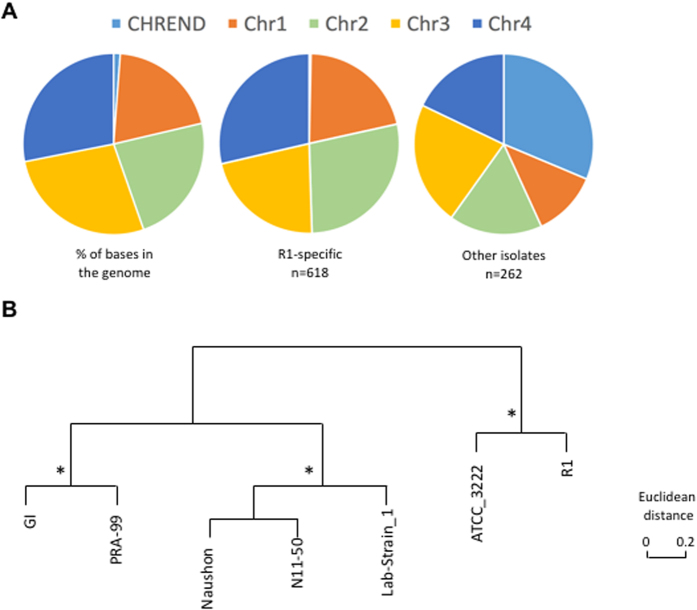
Figure 6. Comparative analysis of mutation frequency in chromosome ends of B. microti isolates.
(A) Pie charts illustrating the mutation frequency in chromosome ends and coding core of chromosomes I to IV as a percentage of total base pairs in the genome (left), and as a percentage of all mutations found to be specific to R1 (middle) or those found to be isolate specific (right). (B) Clustering analysis of B. microti isolates based on 12 microsatellite markers. *Conserved nodes observed in clustering based on differentially expressed genes.

