
Figure 8. Heatmap of the log-transformed relative expressions of 410 genes considered as differentially expressed among 6 B. microti isolates.
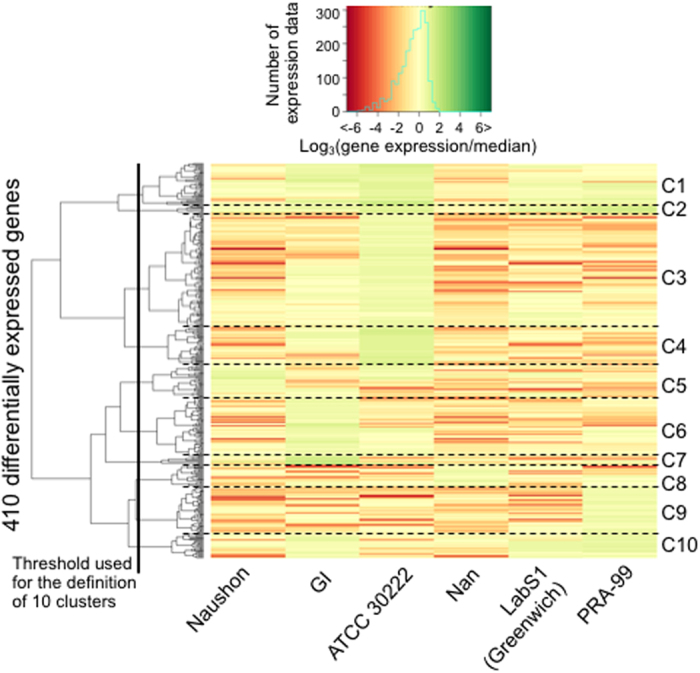
The gene expression was characterized as the log3 of the ratio between expression level in a specific isolate over the median of the expression levels in the 6 isolates. The distance between genes is the Euclidean distance. Ward metrics was used to obtain the dendrogram. Ten gene clusters could be characterized after classification.