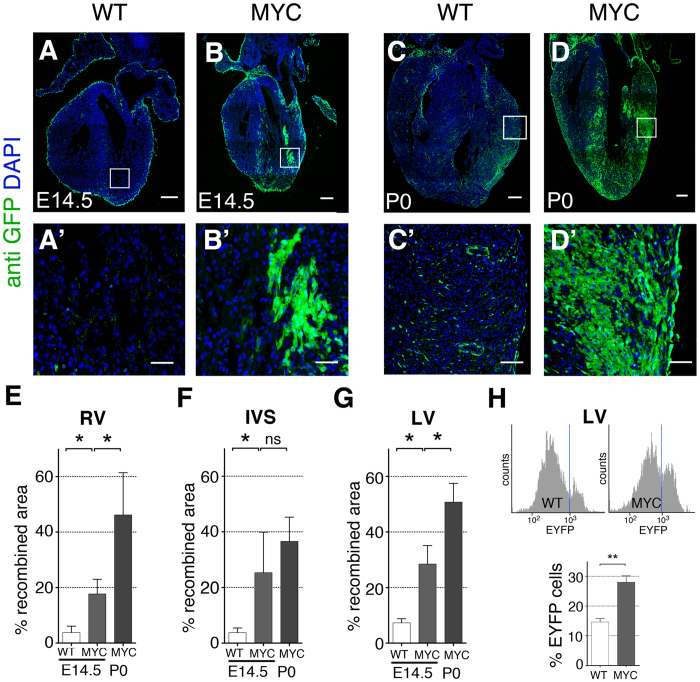
Figure 1. Enhanced myocardial contribution by Myc-overexpressing cells.
(A–B’) Confocal images from histological sections of iMOSWT(WT) (A) and iMOST1-Myc(MYC) (B) hearts at E14.5 induced with Wt1-Cre. (A’,B’) show magnification of the boxed areas shown in (A,B). (C–D’) Confocal images from histological sections of P0 iMOSWT(WT) (C) and iMOST1-Myc(MYC) (D) recombined with Wt1-Cre. (C’,D’) show magnification of the boxed areas shown in (C,D). (E–G) Quantification of the percentage of recombined area detected in iMOSWT(WT) and iMOST1-Myc(MYC) at E14.5 and P0 in the RV (E), IVS (F) and LV (G). (H) Cytometer histogram plot showing Counts (X axis) versus FITC laser (EYFP detection) in iMOSWT(WT) and iMOST1-Myc(MYC) E14.5 whole digested hearts (upper panel). Lower panel shows quantification on EYFP population related to the total amount of live cells detected on the cytometer for iMOSWT(WT) and iMOST1-Myc(MYC) E14.5 hearts. Graphs in E, F, G, H show means ± SEM. *p < 0.05; **p < 0.01; ***p < 0.001. Bar, 200 μm in A, B, C, D and 50 in A’, B’, C’, D’ n ≥ 5 hearts for (A–G) and n ≥ 7 for (H).

