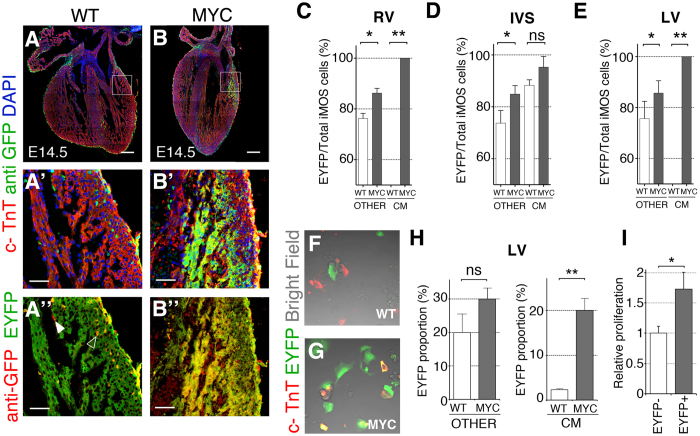
Figure 2. Preferential colonization of the cardiomyocyte lineage by Myc-overexpressing cells.
(A–B’) Confocal images from histological sections of iMOSWT (WT) (A) and iMOST1-Myc(MYC) (B) hearts at E14.5 induced with Wt1-Cre. (A’,B’) show amplified regions from boxed areas in (A,B). (A”,B”) depict amplified regions from boxed areas in (A,B) showing native EYFP and anti-GFP staining. A”, solid indicates an EYFP-negative, anti-GFP-positive cell and empty arrowhead indicates a double-positive cell. (C–E) Percentage of EYFP cells within the iMOS-positive population observed at E14.5 in whole hearts of the iMOSWT (WT) and iMOST1-Myc(MYC) mosaics in the non-cardiomyocyte fraction and in the cardiomyocyte fraction in the RV (C), IVS (D) and LV (E–G) Confocal images showing cultured cells from dissociated E14.5 hearts from iMOSWT(WT) (F) and iMOST1-Myc(MYC) embryos (G,H) Quantification of the proportion of EYFP cells within the non-cardiomyocyte fraction (left graph) and cardiomyocyte fraction (right graph) from dissociated E14.5 hearts from iMOSWT(WT) and iMOST1-Myc(MYC) embryos. (I), Quantification of proliferation in cardiomyocytes of the WT1Cre lineage. Graph shows the frequency per area unit of Ph3+ cardiomyocytes in the EYFP- and EYFP+ populations of Wt1Cre;iMOST1-Mycnewborn hearts. Frequencies were normalized to that observed in the EYFP- cardiomyocyte population. Graphs in (C–E,H,I) show means +SEM. *p < 0.05; **p < 0.01; ***p < 0.001. Bar, 200 μm in A, B, and 50 in (A’,B’,A”,B”) n ≥ 5 hearts.

